Script repository
Note
Usage: Copy-paste the code lines displayed below or the linked .py file contents into Python console in Slicer. Or save them to a .py file and run them using execfile.
To run a Python code snippet automatically at each application startup, add it to the .slicerrc.py file.
Note
More reference code: The Slicer source code has Python scripted modules and scripted Segmentation Editor effects that can be used as working examples.
Most Slicer Extensions are written in Python to address specific use cases. Looking at their source code can be informative.
The Slicer Discourse forum has many code snippets and discussions.
Install Slicer
There are different approaches to install Slicer and extensions programmatically:
Install Slicer manually and install extensions by using
slicer.app.extensionsManagerModel(). See example below and in install-slicer-extension.pyDirectly interact with the REST API endpoints of https://slicer-packages.kitware.com using
curlandjq. See slicer-download.sh
Launch Slicer
Open a file with Slicer at the command line
Open Slicer to view the c:\some\folder\MRHead.nrrd image file:
"c:\Users\myusername\AppData\Local\NA-MIC\Slicer 4.11.20210226\Slicer.exe" c:\some\folder\MRHead.nrrd
Note
It is necessary to specify full path to the Slicer executable and to the file that needs to be loaded.
On Windows, the installer registers the Slicer application during install. This makes it possible to use start command to launch the most recently installed Slicer. For example, this command on the command-line starts Slicer and loads an image:
start Slicer c:\some\folder\MRHead.nrrd
To load a file with non-default options, you can use --python-code option to run slicer.util.load... commands.
Open an .mrb file with Slicer at the command line
Slicer.exe --python-code "slicer.util.loadScene('f:/2013-08-23-Scene.mrb')"
Run Python commands in the Slicer environment
Run Python commands, without showing any graphical user interface:
Slicer.exe --python-code "doSomething; doSomethingElse; etc." --testing --no-splash --no-main-window
Slicer exits when the commands are completed because --testing options is specified.
Run a Python script file in the Slicer environment
Run a Python script on Windows (stored in script file), without showing any graphical user interface:
Slicer.exe --python-script "/full/path/to/myscript.py" --no-splash --no-main-window
Run a Python script on MacOS (stored in script file), without showing any graphical user interface:
/Applications/Slicer.app/Contents/MacOS/Slicer --no-splash --no-main-window --python-script "/full/path/to/myscript.py"
To make Slicer exit when the script execution is completed, call sys.exit(errorCode) (where errorCode is set 0 for success and other value to indicate error).
Launch Slicer directly from a web browser
Slicer can be associated with the slicer: custom URL protocol in the operating system or web browser. This is done automatically in the Windows installer and can be set up on other operating systems manually. After this when the user clicks on a slicer://... URL in the web browser, Slicer will start and the slicer.app object emits a signal with the URL that modules can process. The DICOM module processes DICOMweb URLs, but any module can specify additional actions.
For example, this module will download and view any image if the user clicks on an URL like this in the web browser:
slicer://viewer/?download=https%3A%2F%2Fgithub.com%2Frbumm%2FSlicerLungCTAnalyzer%2Freleases%2Fdownload%2FSampleData%2FLungCTAnalyzerChestCT.nrrd
For reference, the DICOM module downloads a study from a DICOMweb server and shows it when providing a URL like this (which is used for example in the Kheops DICOM data sharing platform):
slicer://viewer/?studyUID=2.16.840.1.113669.632.20.121711.10000158860
    &access_token=k0zR6WAPpNbVguQ8gGUHp6
    &dicomweb_endpoint=http%3A%2F%2Fdemo.kheops.online%2Fapi
    &dicomweb_uri_endpoint=%20http%3A%2F%2Fdemo.kheops.online%2Fapi%2Fwado
MRML scene
Get MRML node from the scene
Get markups point list node named F (useful for quickly getting access to a MRML node in the Python console):
pointListNode = getNode('F')
# do something with the node... let's remove the first control point in it
pointListNode.RemoveNthControlPoint(0)
Getting the first volume node without knowing its name (useful if there is only one volume loaded):
volumeNode = slicer.mrmlScene.GetFirstNodeByClass("vtkMRMLScalarVolumeNode")
# do something with the node... let's change its display window/level
volumeNode.GetDisplayNode().SetAutoWindowLevel(False)
volumeNode.GetDisplayNode().SetWindowLevelMinMax(100, 200)
Note
slicer.util.getNode()is recommended only for interactive debugging in the Python console/Jupyter notebookits input is intentionally defined vaguely (it can be either node ID or name and you can use wildcards such as
*), which is good because it make it simpler to use, but the uncertain behavior is not good for general-purpose use in a modulethrows an exception so that the developer knows immediately that there was a typo or other unexpected error
slicer.mrmlScene.GetNodeByID()is more appropriate when a module needs to access a MRML node:its behavior is more predictable: it only accepts node ID as input.
slicer.mrmlScene.GetFirstNodeByName()can be used to get a node by its name, but since multiple nodes in the scene can have the same name, it is not recommended to keep reference to a node by its name. Since node IDs may change when a scene is saved and reloaded, node ID should not be stored persistently, but node references must be used insteadif node is not found it returns
None(instead of throwing an exception), because this is often not considered an error in module code (it is just used to check existence of a node) and using return value for not-found nodes allows simpler syntax
Clone a node
This example shows how to make a copy of any node that appears in Subject Hierarchy (in Data module).
# Get a node from SampleData that we will clone
import SampleData
nodeToClone = SampleData.SampleDataLogic().downloadMRHead()

# Clone the node
shNode = slicer.vtkMRMLSubjectHierarchyNode.GetSubjectHierarchyNode(slicer.mrmlScene)
itemIDToClone = shNode.GetItemByDataNode(nodeToClone)
clonedItemID = slicer.modules.subjecthierarchy.logic().CloneSubjectHierarchyItem(shNode, itemIDToClone)
clonedNode = shNode.GetItemDataNode(clonedItemID)
Save a node to file
Save a transform node to file (should work with any other node type, if file extension is set to a supported one):
myNode = getNode("LinearTransform_3")

myStorageNode = myNode.CreateDefaultStorageNode()
myStorageNode.SetFileName("c:/tmp/something.tfm")
myStorageNode.WriteData(myNode)
Save the scene into a single MRB file
# Generate file name
import time
sceneSaveFilename = slicer.app.temporaryPath + "/saved-scene-" + time.strftime("%Y%m%d-%H%M%S") + ".mrb"

# Save scene
if slicer.util.saveScene(sceneSaveFilename):
  logging.info("Scene saved to: {0}".format(sceneSaveFilename))
else:
  logging.error("Scene saving failed")
Save the scene into a new directory
# Create a new directory where the scene will be saved into
import time
sceneSaveDirectory = slicer.app.temporaryPath + "/saved-scene-" + time.strftime("%Y%m%d-%H%M%S")
if not os.access(sceneSaveDirectory, os.F_OK):
  os.makedirs(sceneSaveDirectory)

# Save the scene
if slicer.app.applicationLogic().SaveSceneToSlicerDataBundleDirectory(sceneSaveDirectory, None):
  logging.info("Scene saved to: {0}".format(sceneSaveDirectory))
else:
  logging.error("Scene saving failed")
Override default scene save dialog
Place this class in the scripted module file to override
class MyModuleFileDialog ():
  """This specially named class is detected by the scripted loadable
  module and is the target for optional drag and drop operations.
  See: Base/QTGUI/qSlicerScriptedFileDialog.h.

  This class is used for overriding default scene save dialog
  with simple saving the scene without asking anything.
  """

  def __init__(self,qSlicerFileDialog ):
    self.qSlicerFileDialog = qSlicerFileDialog
    qSlicerFileDialog.fileType = "NoFile"
    qSlicerFileDialog.description = "Save scene"
    qSlicerFileDialog.action = slicer.qSlicerFileDialog.Write

  def execDialog(self):
    # Implement custom scene save operation here.
    # Return True if saving completed successfully,
    # return False if saving was cancelled.
    ...
    return saved
Override application close behavior
When application close is requested then by default confirmation popup is displayed. To customize this behavior (for example, allow application closing without displaying default confirmation popup) an event filter can be installed for the close event on the main window:
class CloseApplicationEventFilter(qt.QWidget):
  def eventFilter(self, object, event):
    if event.type() == qt.QEvent.Close:
      event.accept()
      return True
    return False

filter = CloseApplicationEventFilter()
slicer.util.mainWindow().installEventFilter(filter)
Change default output file type for new nodes
This script changes default output file format for nodes that have not been saved yet (do not have storage node yet).
Default node can be specified that will be used as a basis of all new storage nodes. This can be used for setting default file extension. For example, change file format to PLY for model nodes:
defaultModelStorageNode = slicer.vtkMRMLModelStorageNode()
defaultModelStorageNode.SetDefaultWriteFileExtension("ply")
slicer.mrmlScene.AddDefaultNode(defaultModelStorageNode)
To permanently change default file extension on your computer, copy-paste the code above into your application startup script (you can find its location in menu: Edit / Application settings / General / Application startup script).
Change file type for saving for existing nodes
This script changes output file types for nodes that have been already saved (they already have storage node).
If it is not necessary to preserve file paths then the simplest is to configure default storage node (as shown in the example above), then delete all existing storage nodes. When save dialog is opened, default storage nodes will be recreated.
# Delete existing model storage nodes so that they will be recreated with default settings
existingModelStorageNodes = slicer.util.getNodesByClass("vtkMRMLModelStorageNode")
for modelStorageNode in existingModelStorageNodes:
  slicer.mrmlScene.RemoveNode(modelStorageNode)
To update existing storage nodes to use new file extension (but keep all other parameters unchanged) you can use this approach (example is for volume storage):
requiredFileExtension = ".nia"
originalFileExtension = ".nrrd"
volumeNodes = slicer.util.getNodesByClass("vtkMRMLScalarVolumeNode")
for volumeNode in volumeNodes:
  volumeStorageNode = volumeNode.GetStorageNode()
  if not volumeStorageNode:
    volumeNode.AddDefaultStorageNode()
    volumeStorageNode = volumeNode.GetStorageNode()
    volumeStorageNode.SetFileName(volumeNode.GetName()+requiredFileExtension)
  else:
    volumeStorageNode.SetFileName(volumeStorageNode.GetFileName().replace(originalFileExtension, requiredFileExtension))
To set all volume nodes to save uncompressed by default (add this to slicerrc.py file so it takes effect for the whole session):
# Set the default volume storage to not compress by default
defaultVolumeStorageNode = slicer.vtkMRMLVolumeArchetypeStorageNode()
defaultVolumeStorageNode.SetUseCompression(0)
slicer.mrmlScene.AddDefaultNode(defaultVolumeStorageNode)
logging.info("Volume nodes will be stored uncompressed by default")
Same thing as above, but applied to all segmentations instead of volumes:
# Set the default segmentation storage to not compress by default
defaultSegmentationStorageNode = slicer.vtkMRMLSegmentationStorageNode()
defaultSegmentationStorageNode.SetUseCompression(0)
slicer.mrmlScene.AddDefaultNode(defaultSegmentationStorageNode)
logging.info("Segmentation nodes will be stored uncompressed by default")
Module selection
Switch to a different module
This utility function can be used to open a different module:
slicer.util.selectModule("DICOM")
Set a new default module at startup
Instead of the default Welcome module:
qt.QSettings().setValue("Modules/HomeModule", "Data")
Views
Display text in a 3D view or slice view
The easiest way to show information overlaid on a viewer is to use corner annotations.
view=slicer.app.layoutManager().threeDWidget(0).threeDView()
# Set text to "Something"
view.cornerAnnotation().SetText(vtk.vtkCornerAnnotation.UpperRight,"Something")
# Set color to red
view.cornerAnnotation().GetTextProperty().SetColor(1,0,0)
# Update the view
view.forceRender()
To display text in slice views, replace the first line by this line (and consider hiding slice view annotations, to prevent them from overwriting the text you place there):
view=slicer.app.layoutManager().sliceWidget("Red").sliceView()
Activate hanging protocol by keyboard shortcut
This code snippet shows how to specify a hanging protocol for PET/CT with the following properties:
window/level and colormap is set to standardized values
any acquisition transforms hardened on the images (these transforms are created for example when the image is acquired with varying slice spacing)
show PET/CT images fused in slice views
show PET image and fused image slices in 3D view
The hanging protocol can be activated using the Ctrl+9 keyboard shortcut.
def useHangingProtocolPetCt():
    ctImage = None
    petImage = None

    shNode = slicer.vtkMRMLSubjectHierarchyNode.GetSubjectHierarchyNode(slicer.mrmlScene)
    petColor = slicer.mrmlScene.GetFirstNodeByName('PET-Heat')
    for imageNode in slicer.util.getNodesByClass('vtkMRMLScalarVolumeNode'):
        # Harden any transform (in case the image is stored non-uniform spacing, etc.
        # hardening the acquisition transforms creates a single Cartesian volume)
        imageNode.HardenTransform()

        # Set window/level and colormap for recognized image types
        imageItem = shNode.GetItemByDataNode(imageNode)
        modality = shNode.GetItemAttribute(imageItem, 'DICOM.Modality')
        if modality == "CT":
            ctImage = imageNode
            ctImage.GetVolumeDisplayNode().SetAndObserveColorNodeID(petColor.GetID())
            slicer.modules.volumes.logic().ApplyVolumeDisplayPreset(ctImage.GetVolumeDisplayNode(), "CT_ABDOMEN")
        elif modality == "PT":
            petImage = imageNode
            petImage.GetVolumeDisplayNode().SetAndObserveColorNodeID(petColor.GetID())
            petImage.GetVolumeDisplayNode().SetWindowLevelMinMax(0, 20)

    # Set up view layout and content
    slicer.app.layoutManager().setLayout(slicer.vtkMRMLLayoutNode.SlicerLayoutFourUpView)
    slicer.util.setSliceViewerLayers(background=ctImage, foreground=petImage, foregroundOpacity=0.3, fit=True)

    # Show the PET image in 3D view using volume rendering
    vrLogic = slicer.modules.volumerendering.logic()
    vrDisplayNode = vrLogic.CreateDefaultVolumeRenderingNodes(petImage)
    vrDisplayNode.SetVisibility(True)
    # Use the same window/level and colormap settings for volume rendering as for slice display
    vrDisplayNode.SetFollowVolumeDisplayNode(True)

    # Show slice views in 3D view
    layoutManager = slicer.app.layoutManager()
    for sliceViewName in layoutManager.sliceViewNames():
        controller = layoutManager.sliceWidget(sliceViewName).sliceController()
        controller.setSliceVisible(True)

    # Center and fit displayed content in 3D view
    layoutManager = slicer.app.layoutManager()
    threeDWidget = layoutManager.threeDWidget(0)
    threeDView = threeDWidget.threeDView()
    threeDView.rotateToViewAxis(3)  # look from anterior direction
    threeDView.resetFocalPoint()  # reset the 3D view cube size and center it
    threeDView.resetCamera()  # reset camera zoom

    return [ctImage, petImage]

# Register keyboard shortcut
shortcut = qt.QShortcut(slicer.util.mainWindow())
shortcut.setKey(qt.QKeySequence("Ctrl+9"))
shortcut.connect( "activated()", useHangingProtocolPetCt)
Show orientation marker in all views
viewNodes = slicer.util.getNodesByClass("vtkMRMLAbstractViewNode")
for viewNode in viewNodes:
  viewNode.SetOrientationMarkerType(slicer.vtkMRMLAbstractViewNode.OrientationMarkerTypeAxes)
Change view axis labels
labels = ["x", "X", "y", "Y", "z", "Z"]
viewNode = slicer.app.layoutManager().threeDWidget(0).mrmlViewNode()
# for slice view:
# viewNode = slicer.app.layoutManager().sliceWidget("Red").mrmlSliceNode()
for index, label in enumerate(labels):
  viewNode.SetAxisLabel(index, label)
Hide view controller bars
slicer.app.layoutManager().threeDWidget(0).threeDController().setVisible(False)
slicer.app.layoutManager().sliceWidget("Red").sliceController().setVisible(False)
slicer.app.layoutManager().plotWidget(0).plotController().setVisible(False)
slicer.app.layoutManager().tableWidget(0).tableController().setVisible(False)
Hide Slicer logo from main window
This script increases vertical space available in the module panel by hiding the Slicer application logo.
slicer.util.findChild(slicer.util.mainWindow(), "LogoLabel").visible = False
Customize widgets in view controller bars
sliceController = slicer.app.layoutManager().sliceWidget("Red").sliceController()

# hide what is not needed
sliceController.pinButton().hide()
#sliceController.viewLabel().hide()
sliceController.fitToWindowToolButton().hide()
sliceController.sliceOffsetSlider().hide()

# add custom widgets
myButton = qt.QPushButton("My custom button")
sliceController.barLayout().addWidget(myButton)
Display a node in only some views
Show a displayable node in a predefined set of views. Here, show a markups line only in Red+, Green+ and Yellow+ views.
displayableNode = getNode("L")

viewNodeIDs = [
  slicer.app.layoutManager().sliceWidget(viewName).mrmlSliceNode().GetID()
  for viewName in ["Red+", "Green+", "Yellow+"]
]

displayableNode.GetDisplayNode().SetViewNodeIDs(viewNodeIDs)
Get current mouse coordinates in a slice view
You can get 3D (RAS) coordinates of the current mouse cursor from the crosshair singleton node as shown in the example below:
def onMouseMoved(observer,eventid):
  ras=[0,0,0]
  crosshairNode.GetCursorPositionRAS(ras)
  print(ras)

crosshairNode=slicer.util.getNode("Crosshair")
crosshairNode.AddObserver(slicer.vtkMRMLCrosshairNode.CursorPositionModifiedEvent, onMouseMoved)
Display crosshair at a 3D position
position_RAS = [23.4, 5.6, 78.9]
crosshairNode = slicer.util.getNode("Crosshair")
# Set crosshair position
crosshairNode.SetCrosshairRAS(position_RAS)
# Center the position in all slice views
slicer.vtkMRMLSliceNode.JumpAllSlices(slicer.mrmlScene, *position_RAS, slicer.vtkMRMLSliceNode.CenteredJumpSlice)
# Make the crosshair visible
crosshairNode.SetCrosshairMode(slicer.vtkMRMLCrosshairNode.ShowBasic)
Note
Crosshair node stores two positions: Cursor position is the current position of the mouse pointer in a slice or 3D view (modules should only read this position). Crosshair position is the location of the visible crosshair in views (modules can read or write this position).
Change the crosshair color
# Get the crosshair node
crosshairNode = slicer.util.getNode("Crosshair")
# Set the crosshair color to Red
crosshairNode.SetCrosshairColor(1.0, 0.0, 0.0)
Display mouse pointer coordinates in alternative coordinate system
The Data probe only shows coordinate values in the world coordinate system. You can make the world coordinate system mean anything you want (e.g., MNI) by applying a transform to the volume that transforms it into that space. See more details in here .
def onMouseMoved(observer,eventid):
  mniToWorldTransformNode = getNode("LinearTransform_3")  # replace this by the name of your actual MNI to world transform
  worldToMniTransform = vtk.vtkGeneralTransform()
  mniToWorldTransformNode.GetTransformToWorld(worldToMniTransform)
  ras=[0,0,0]
  mni=[0,0,0]
  crosshairNode.GetCursorPositionRAS(ras)
  worldToMniTransform.TransformPoint(ras, mni)
  _ras = "; ".join([str(k) for k in ras])
  _mni = "; ".join([str(k) for k in mni])
  slicer.util.showStatusMessage(f"RAS={_ras}   MNI={_mni}")

crosshairNode=slicer.util.getNode("Crosshair")
observationId = crosshairNode.AddObserver(slicer.vtkMRMLCrosshairNode.CursorPositionModifiedEvent, onMouseMoved)

# Run this to stop displaying values:
# crosshairNode.RemoveObserver(observationId)
Get 3D coordinates from 2D display coordinates
If 2D display position (in pixels) of a model’s surface point is known then this code snippet can compute its position in 3D (in world coordinate system).
# Display position is in pixels, origin is top-left corner
displayPosition = [10, 12]

# Get model displayable manager
threeDViewNode = slicer.mrmlScene.GetNodeByID("vtkMRMLViewNode1")
appLogic = slicer.app.applicationLogic()
modelDisplayableManager = appLogic.GetViewDisplayableManagerByClassName(threeDViewNode, "vtkMRMLModelDisplayableManager")

# Use model displayable manager's point picker
if modelDisplayableManager.Pick(displayPosition[0], displayPosition[1]) and modelDisplayableManager.GetPickedNodeID():
    rasPosition = modelDisplayableManager.GetPickedRAS()
    print(rasPosition)
else:
    print(f"No model is visible at {displayPosition}")
Get DataProbe text
You can get the mouse location in pixel coordinates along with the pixel value at the mouse by hitting the . (period) key in a slice view after pasting in the following code.
def printDataProbe():
  infoWidget = slicer.modules.DataProbeInstance.infoWidget
  for layer in ("B", "F", "L"):
    print(infoWidget.layerNames[layer].text, infoWidget.layerIJKs[layer].text, infoWidget.layerValues[layer].text)

s = qt.QShortcut(qt.QKeySequence("."), mainWindow())
s.connect("activated()", printDataProbe)
Create custom color table
This example shows how to create a new color table, for example with inverted color range from the default Ocean color table.
invertedocean = slicer.vtkMRMLColorTableNode()
invertedocean.SetTypeToUser()
invertedocean.SetNumberOfColors(256)
invertedocean.SetName("InvertedOcean")

for i in range(0,255):
  invertedocean.SetColor(i, 0.0, 1 - (i+1e-16)/255.0, 1.0, 1.0)

slicer.mrmlScene.AddNode(invertedocean)
Show color legend for a volume node
Display color legend for a volume node in slice views (and in 3D views, if the slice is displayed in 3D):
volumeNode = getNode('MRHead')
colorLegendDisplayNode = slicer.modules.colors.logic().AddDefaultColorLegendDisplayNode(volumeNode)
Create custom color map and display color legend
modelNode = getNode('MyModel')  # color legend requires a displayable node
colorTableRangeMm = 40
title ="Radial\nCompression\n"
labelFormat = "%4.1f mm"

# Create color node
colorNode = slicer.mrmlScene.CreateNodeByClass("vtkMRMLProceduralColorNode")
colorNode.UnRegister(None)  # to prevent memory leaks
colorNode.SetName(slicer.mrmlScene.GenerateUniqueName("MyColormap"))
colorNode.SetAttribute("Category", "MyModule")
# The color node is a procedural color node, which is saved using a storage node.
# Hidden nodes are not saved if they use a storage node, therefore
# the color node must be visible.
colorNode.SetHideFromEditors(False)
slicer.mrmlScene.AddNode(colorNode)

# Specify colormap
colorMap = colorNode.GetColorTransferFunction()
colorMap.RemoveAllPoints()
colorMap.AddRGBPoint(colorTableRangeMm * 0.0, 0.0, 0.0, 1.0)
colorMap.AddRGBPoint(colorTableRangeMm * 0.2, 0.0, 1.0, 1.0)
colorMap.AddRGBPoint(colorTableRangeMm * 0.5, 1.0, 1.0, 0.0)
colorMap.AddRGBPoint(colorTableRangeMm * 1.0, 1.0, 0.0, 0.0)

# Display color legend
modelNode.GetDisplayNode().SetAndObserveColorNodeID(colorNode.GetID())
colorLegendDisplayNode = slicer.modules.colors.logic().AddDefaultColorLegendDisplayNode(modelNode)
colorLegendDisplayNode.SetTitleText(title)
colorLegendDisplayNode.SetLabelFormat(labelFormat)
Customize view layout
Show a custom layout of a 3D view on top of the red slice view:
customLayout = """
<layout type="vertical" split="true">
  <item>
  <view class="vtkMRMLViewNode" singletontag="1">
    <property name="viewlabel" action="default">1</property>
  </view>
  </item>
  <item>
  <view class="vtkMRMLSliceNode" singletontag="Red">
    <property name="orientation" action="default">Axial</property>
    <property name="viewlabel" action="default">R</property>
    <property name="viewcolor" action="default">#F34A33</property>
  </view>
  </item>
</layout>
"""

# Built-in layout IDs are all below 100, so you can choose any large random number
# for your custom layout ID.
customLayoutId=501

layoutManager = slicer.app.layoutManager()
layoutManager.layoutLogic().GetLayoutNode().AddLayoutDescription(customLayoutId, customLayout)

# Switch to the new custom layout
layoutManager.setLayout(customLayoutId)
See description of standard layouts (that can be used as examples) here: https://github.com/Slicer/Slicer/blob/main/Libs/MRML/Logic/vtkMRMLLayoutLogic.cxx
You can use this code snippet to add a button to the layout selector toolbar:
# Add button to layout selector toolbar for this custom layout
viewToolBar = mainWindow().findChild("QToolBar", "ViewToolBar")
layoutMenu = viewToolBar.widgetForAction(viewToolBar.actions()[0]).menu()
layoutSwitchActionParent = layoutMenu  # use `layoutMenu` to add inside layout list, use `viewToolBar` to add next the standard layout list
layoutSwitchAction = layoutSwitchActionParent.addAction("My view") # add inside layout list
layoutSwitchAction.setData(customLayoutId)
layoutSwitchAction.setIcon(qt.QIcon(":Icons/Go.png"))
layoutSwitchAction.setToolTip("3D and slice view")
Turn on slice intersections
sliceDisplayNodes = slicer.util.getNodesByClass("vtkMRMLSliceDisplayNode")
for sliceDisplayNode in sliceDisplayNodes:
  sliceDisplayNode.SetIntersectingSlicesVisibility(1)

# Workaround to force visual update (see https://github.com/Slicer/Slicer/issues/6338)
sliceNodes = slicer.util.getNodesByClass('vtkMRMLSliceNode')
for sliceNode in sliceNodes:
    sliceNode.Modified()
Note
How to find code corresponding to a user interface widget?
For this one I searched for “slice intersections” text in the whole Slicer source code, found that the function is implemented in Base\QTGUI\qSlicerViewersToolBar.cxx, then translated the qSlicerViewersToolBarPrivate::setSliceIntersectionVisible(bool visible) method to Python.
Hide slice view annotations
This script can hide node name, patient information displayed in corners of slice views (managed by DataProbe module).
# Disable slice annotations immediately
sliceAnnotations = slicer.modules.DataProbeInstance.infoWidget.sliceAnnotations
sliceAnnotations.sliceViewAnnotationsEnabled=False
sliceAnnotations.updateSliceViewFromGUI()
# Disable slice annotations persistently (after Slicer restarts)
settings = qt.QSettings()
settings.setValue("DataProbe/sliceViewAnnotations.enabled", 0)
Change slice offset
Equivalent to moving the slider in slice view controller.
layoutManager = slicer.app.layoutManager()
red = layoutManager.sliceWidget("Red")
redLogic = red.sliceLogic()
# Print current slice offset position
print(redLogic.GetSliceOffset())
# Change slice position
redLogic.SetSliceOffset(20)
Change slice orientation
Get Red slice node and rotate around X and Y axes.
sliceNode = slicer.app.layoutManager().sliceWidget("Red").mrmlSliceNode()
sliceToRas = sliceNode.GetSliceToRAS()
transform=vtk.vtkTransform()
transform.SetMatrix(sliceToRas)
transform.RotateX(20)
transform.RotateY(15)
sliceToRas.DeepCopy(transform.GetMatrix())
sliceNode.UpdateMatrices()
Measure angle between two slice planes
Measure angle between red and yellow slice nodes. Whenever any of the slice nodes are moved, the updated angle is printed on the console.
sliceNodeIds = ["vtkMRMLSliceNodeRed", "vtkMRMLSliceNodeYellow"]

# Print angles between slice nodes
def ShowAngle(unused1=None, unused2=None):
  sliceNormalVector = []
  for sliceNodeId in sliceNodeIds:
    sliceToRAS = slicer.mrmlScene.GetNodeByID(sliceNodeId).GetSliceToRAS()
    sliceNormalVector.append([sliceToRAS.GetElement(0,2), sliceToRAS.GetElement(1,2), sliceToRAS.GetElement(2,2)])
  angleRad = vtk.vtkMath.AngleBetweenVectors(sliceNormalVector[0], sliceNormalVector[1])
  angleDeg = vtk.vtkMath.DegreesFromRadians(angleRad)
  print("Angle between slice planes = {0:0.3f}".format(angleDeg))

# Observe slice node changes
for sliceNodeId in sliceNodeIds:
  slicer.mrmlScene.GetNodeByID(sliceNodeId).AddObserver(vtk.vtkCommand.ModifiedEvent, ShowAngle)

# Print current angle
ShowAngle()
Set slice position and orientation from a normal vector and position
This code snippet shows how to display a slice view defined by a normal vector and position in an anatomically sensible way: rotating slice view so that “up” direction (or “right” direction) is towards an anatomical axis.
def setSlicePoseFromSliceNormalAndPosition(sliceNode, sliceNormal, slicePosition, defaultViewUpDirection=None, backupViewRightDirection=None):
  """
  Set slice pose from the provided plane normal and position. View up direction is determined automatically,
  to make view up point towards defaultViewUpDirection.
  :param defaultViewUpDirection Slice view will be spinned in-plane to match point approximately this up direction. Default: patient superior.
  :param backupViewRightDirection Slice view will be spinned in-plane to match point approximately this right direction
    if defaultViewUpDirection is too similar to sliceNormal. Default: patient left.
  """
  # Fix up input directions
  if defaultViewUpDirection is None:
    defaultViewUpDirection = [0,0,1]
  if backupViewRightDirection is None:
    backupViewRightDirection = [-1,0,0]
  if sliceNormal[1]>=0:
    sliceNormalStandardized = sliceNormal
  else:
    sliceNormalStandardized = [-sliceNormal[0], -sliceNormal[1], -sliceNormal[2]]
  # Compute slice axes
  sliceNormalViewUpAngle = vtk.vtkMath.AngleBetweenVectors(sliceNormalStandardized, defaultViewUpDirection)
  angleTooSmallThresholdRad = 0.25 # about 15 degrees
  if sliceNormalViewUpAngle > angleTooSmallThresholdRad and sliceNormalViewUpAngle < vtk.vtkMath.Pi() - angleTooSmallThresholdRad:
    viewUpDirection = defaultViewUpDirection
    sliceAxisY = viewUpDirection
    sliceAxisX = [0, 0, 0]
    vtk.vtkMath.Cross(sliceAxisY, sliceNormalStandardized, sliceAxisX)
  else:
    sliceAxisX = backupViewRightDirection
  # Set slice axes
  sliceNode.SetSliceToRASByNTP(sliceNormalStandardized[0], sliceNormalStandardized[1], sliceNormalStandardized[2],
    sliceAxisX[0], sliceAxisX[1], sliceAxisX[2],
    slicePosition[0], slicePosition[1], slicePosition[2], 0)

# Example usage:
sliceNode = getNode("vtkMRMLSliceNodeRed")
transformNode = getNode("Transform_3")
transformMatrix = vtk.vtkMatrix4x4()
transformNode.GetMatrixTransformToParent(transformMatrix)
sliceNormal = [transformMatrix.GetElement(0,2), transformMatrix.GetElement(1,2), transformMatrix.GetElement(2,2)]
slicePosition = [transformMatrix.GetElement(0,3), transformMatrix.GetElement(1,3), transformMatrix.GetElement(2,3)]
setSlicePoseFromSliceNormalAndPosition(sliceNode, sliceNormal, slicePosition)
Show slice views in 3D window
Equivalent to clicking ‘eye’ icon in the slice view controller.
layoutManager = slicer.app.layoutManager()
for sliceViewName in layoutManager.sliceViewNames():
  controller = layoutManager.sliceWidget(sliceViewName).sliceController()
  controller.setSliceVisible(True)
Change default slice view orientation
You can left-right “flip” slice view orientation presets (show patient left side on left/right side of the screen) by copy-pasting the script below to your slicerrc.py file.
# Axial slice axes:
#  1 0 0
#  0 1 0
#  0 0 1
axialSliceToRas=vtk.vtkMatrix3x3()

# Coronal slice axes:
#  1 0 0
#  0 0 -1
#  0 1 0
coronalSliceToRas=vtk.vtkMatrix3x3()
coronalSliceToRas.SetElement(1,1, 0)
coronalSliceToRas.SetElement(1,2, -1)
coronalSliceToRas.SetElement(2,1, 1)
coronalSliceToRas.SetElement(2,2, 0)

# Replace orientation presets in all existing slice nodes and in the default slice node
sliceNodes = slicer.util.getNodesByClass("vtkMRMLSliceNode")
sliceNodes.append(slicer.mrmlScene.GetDefaultNodeByClass("vtkMRMLSliceNode"))
for sliceNode in sliceNodes:
  orientationPresetName = sliceNode.GetOrientation()
  sliceNode.RemoveSliceOrientationPreset("Axial")
  sliceNode.AddSliceOrientationPreset("Axial", axialSliceToRas)
  sliceNode.RemoveSliceOrientationPreset("Coronal")
  sliceNode.AddSliceOrientationPreset("Coronal", coronalSliceToRas)
  sliceNode.SetOrientation(orientationPresetName)
Set all slice views linked by default
You can make slice views linked by default (when application starts or the scene is cleared) by copy-pasting the script below to your .slicerrc.py file.
# Set linked slice views  in all existing slice composite nodes and in the default node
sliceCompositeNodes = slicer.util.getNodesByClass("vtkMRMLSliceCompositeNode")
defaultSliceCompositeNode = slicer.mrmlScene.GetDefaultNodeByClass("vtkMRMLSliceCompositeNode")
if not defaultSliceCompositeNode:
  defaultSliceCompositeNode = slicer.mrmlScene.CreateNodeByClass("vtkMRMLSliceCompositeNode")
  defaultSliceCompositeNode.UnRegister(None)  # CreateNodeByClass is factory method, need to unregister the result to prevent memory leaks
  slicer.mrmlScene.AddDefaultNode(defaultSliceCompositeNode)
sliceCompositeNodes.append(defaultSliceCompositeNode)
for sliceCompositeNode in sliceCompositeNodes:
  sliceCompositeNode.SetLinkedControl(True)
Set crosshair jump mode to centered by default
You can change default slice jump mode (when application starts or the scene is cleared) by copy-pasting the script below to your .slicerrc.py file.
crosshair=slicer.mrmlScene.GetFirstNodeByClass("vtkMRMLCrosshairNode")
crosshair.SetCrosshairBehavior(crosshair.CenteredJumpSlice)
Set up custom units in slice view ruler
For microscopy or micro-CT images you may want to switch unit to micrometer instead of the default mm. To do that, 1. change the unit in Application settings / Units and 2. update ruler display settings using the script below (it can be copied to your Application startup script):
appLogic = slicer.app.applicationLogic()
layoutManagerLogic = slicer.app.layoutManager().layoutLogic()
for viewNode in layoutManagerLogic.GetViewNodes():
  if type(viewNode) is not slicer.vtkMRMLSliceNode:
    continue
  displayableManager = appLogic.GetViewDisplayableManagerByClassName(viewNode, "vtkMRMLRulerDisplayableManager")
  displayableManager.RemoveAllRulerScalePresets()
  displayableManager.AddRulerScalePreset(   0.001, 5, 2, "nm", 1000.0)
  displayableManager.AddRulerScalePreset(   0.010, 5, 2, "nm", 1000.0)
  displayableManager.AddRulerScalePreset(   0.100, 5, 2, "nm", 1000.0)
  displayableManager.AddRulerScalePreset(   0.500, 5, 1, "nm", 1000.0)
  displayableManager.AddRulerScalePreset(   1.0,   5, 2, "um",    1.0)
  displayableManager.AddRulerScalePreset(   5.0,   5, 1, "um",    1.0)
  displayableManager.AddRulerScalePreset(  10.0,   5, 2, "um",    1.0)
  displayableManager.AddRulerScalePreset(  50.0,   5, 1, "um",    1.0)
  displayableManager.AddRulerScalePreset( 100.0,   5, 2, "um",    1.0)
  displayableManager.AddRulerScalePreset( 500.0,   5, 1, "um",    1.0)
  displayableManager.AddRulerScalePreset(1000.0,   5, 2, "mm",    0.001)
Center the 3D view on the scene
layoutManager = slicer.app.layoutManager()
threeDWidget = layoutManager.threeDWidget(0)
threeDView = threeDWidget.threeDView()
threeDView.resetFocalPoint()
Rotate the 3D View
layoutManager = slicer.app.layoutManager()
threeDWidget = layoutManager.threeDWidget(0)
threeDView = threeDWidget.threeDView()
threeDView.yaw()
Change 3D view background color
viewNode = slicer.app.layoutManager().threeDWidget(0).mrmlViewNode()
viewNode.SetBackgroundColor(1,0,0)
viewNode.SetBackgroundColor2(1,0,0)
Change box color in 3D view
viewNode = slicer.app.layoutManager().threeDWidget(0).mrmlViewNode()
viewNode.SetBoxColor(1,0,0)
Show a slice view outside the view layout
# layout name is used to create and identify the underlying slice node and  should be set to a value that is not used in any of the layouts owned by the layout manager
layoutName = "TestSlice1"
layoutLabel = "TS1"
layoutColor = [1.0, 1.0, 0.0]
# ownerNode manages this view instead of the layout manager (it can be any node in the scene)
viewOwnerNode = slicer.mrmlScene.AddNewNodeByClass("vtkMRMLScriptedModuleNode")

# Create MRML nodes
viewLogic = slicer.vtkMRMLSliceLogic()
viewLogic.SetMRMLScene(slicer.mrmlScene)
viewNode = viewLogic.AddSliceNode(layoutName)
viewNode.SetLayoutLabel(layoutLabel)
viewNode.SetLayoutColor(layoutColor)
viewNode.SetAndObserveParentLayoutNodeID(viewOwnerNode.GetID())

# Create widget
viewWidget = slicer.qMRMLSliceWidget()
viewWidget.setMRMLScene(slicer.mrmlScene)
viewWidget.setMRMLSliceNode(viewNode)
sliceLogics = slicer.app.applicationLogic().GetSliceLogics()
viewWidget.setSliceLogics(sliceLogics)
sliceLogics.AddItem(viewWidget.sliceLogic())
viewWidget.show()
Show a 3D view outside the view layout
# layout name is used to create and identify the underlying view node and  should be set to a value that is not used in any of the layouts owned by the layout manager
layoutName = "Test3DView"
layoutLabel = "T3"
layoutColor = [1.0, 1.0, 0.0]
# ownerNode manages this view instead of the layout manager (it can be any node in the scene)
viewOwnerNode = slicer.mrmlScene.AddNewNodeByClass("vtkMRMLScriptedModuleNode")

# Create MRML node
viewLogic = slicer.vtkMRMLViewLogic()
viewLogic.SetMRMLScene(slicer.mrmlScene)
viewNode = viewLogic.AddViewNode(layoutName)
viewNode.SetLayoutLabel(layoutLabel)
viewNode.SetLayoutColor(layoutColor)
viewNode.SetAndObserveParentLayoutNodeID(viewOwnerNode.GetID())

# Create widget
viewWidget = slicer.qMRMLThreeDWidget()
viewWidget.setMRMLScene(slicer.mrmlScene)
viewWidget.setMRMLViewNode(viewNode)
viewWidget.show()
Access VTK rendering classes
Access VTK views, renderers, and cameras
Iterate through all 3D views in current layout:
layoutManager = slicer.app.layoutManager()
for threeDViewIndex in range(layoutManager.threeDViewCount) :
  view = layoutManager.threeDWidget(threeDViewIndex).threeDView()
  threeDViewNode = view.mrmlViewNode()
  cameraNode = slicer.modules.cameras.logic().GetViewActiveCameraNode(threeDViewNode)
  print("View node for 3D widget " + str(threeDViewIndex))
  print("  Name: " + threeDViewNode .GetName())
  print("  ID: " + threeDViewNode .GetID())
  print("  Camera ID: " + cameraNode.GetID())
Iterate through all slice views in current layout:
layoutManager = slicer.app.layoutManager()
for sliceViewName in layoutManager.sliceViewNames():
  view = layoutManager.sliceWidget(sliceViewName).sliceView()
  sliceNode = view.mrmlSliceNode()
  sliceLogic = slicer.app.applicationLogic().GetSliceLogic(sliceNode)
  compositeNode = sliceLogic.GetSliceCompositeNode()
  print("Slice view " + str(sliceViewName))
  print("  Name: " + sliceNode.GetName())
  print("  ID: " + sliceNode.GetID())
  print("  Background volume: {0}".format(compositeNode.GetBackgroundVolumeID()))
  print("  Foreground volume: {0} (opacity: {1})".format(compositeNode.GetForegroundVolumeID(), compositeNode.GetForegroundOpacity()))
  print("  Label volume: {0} (opacity: {1})".format(compositeNode.GetLabelVolumeID(), compositeNode.GetLabelOpacity()))
For low-level manipulation of views, it is possible to access VTK render windows, renderers and cameras of views in the current layout.
renderWindow = view.renderWindow()
renderers = renderWindow.GetRenderers()
renderer = renderers.GetItemAsObject(0)
camera = cameraNode.GetCamera()
Get displayable manager of a certain type for a certain view
Displayable managers are responsible for creating VTK filters, mappers, and actors to display MRML nodes in renderers. Input to filters and mappers are VTK objects stored in MRML data nodes. Filter and actor properties are set based on display options specified in MRML display nodes.
Accessing displayable managers is useful for troubleshooting or for testing new features that are not exposed via MRML classes yet, as they provide usually allow low-level access to VTK actors.
threeDViewNode = slicer.mrmlScene.GetNodeByID("vtkMRMLViewNode1")
appLogic = slicer.app.applicationLogic()
modelDisplayableManager = appLogic.GetViewDisplayableManagerByClassName(threeDViewNode, "vtkMRMLModelDisplayableManager")
if modelDisplayableManager is None:
  logging.error("Failed to find the model displayable manager")
Access VTK actor properties
This example shows how to access and modify VTK actor properties to experiment with physically-based rendering.
modelNode = slicer.util.getNode("MyModel")

threeDViewNode = slicer.mrmlScene.GetNodeByID("vtkMRMLViewNode1")
appLogic = slicer.app.applicationLogic()
modelDisplayableManager = appLogic.GetViewDisplayableManagerByClassName(threeDViewNode, "vtkMRMLModelDisplayableManager")
actor=modelDisplayableManager.GetActorByID(modelNode.GetDisplayNode().GetID())
property=actor.GetProperty()
property.SetInterpolationToPBR()
property.SetMetallic(0.5)
property.SetRoughness(0.5)
property.SetColor(0.5,0.5,0.9)
slicer.util.forceRenderAllViews()
See more information on physically based rendering in VTK here: https://blog.kitware.com/vtk-pbr/
Keyboard shortcuts and mouse gestures
Customize keyboard shortcuts
Keyboard shortcuts can be specified for activating any Slicer feature by adding a couple of lines to your .slicerrc.py file.
For example, this script registers Ctrl+b, Ctrl+n, Ctrl+m, Ctrl+, keyboard shortcuts to switch between red, yellow, green, and 4-up view layouts.
shortcuts = [
  ("Ctrl+b", lambda: slicer.app.layoutManager().setLayout(slicer.vtkMRMLLayoutNode.SlicerLayoutOneUpRedSliceView)),
  ("Ctrl+n", lambda: slicer.app.layoutManager().setLayout(slicer.vtkMRMLLayoutNode.SlicerLayoutOneUpYellowSliceView)),
  ("Ctrl+m", lambda: slicer.app.layoutManager().setLayout(slicer.vtkMRMLLayoutNode.SlicerLayoutOneUpGreenSliceView)),
  ("Ctrl+,", lambda: slicer.app.layoutManager().setLayout(slicer.vtkMRMLLayoutNode.SlicerLayoutFourUpView))
  ]

for (shortcutKey, callback) in shortcuts:
  shortcut = qt.QShortcut(slicer.util.mainWindow())
  shortcut.setKey(qt.QKeySequence(shortcutKey))
  shortcut.connect( "activated()", callback)
Here’s an example for cycling through Segment Editor effects (requested on the Slicer forum for the SlicerMorph project).
def cycleEffect(delta=1):
  try:
    orderedNames = list(slicer.modules.SegmentEditorWidget.editor.effectNameOrder())
    allNames = slicer.modules.SegmentEditorWidget.editor.availableEffectNames()
    for name in allNames:
      try:
        orderedNames.index(name)
      except ValueError:
        orderedNames.append(name)
    orderedNames.insert(0, None)
    activeEffect = slicer.modules.SegmentEditorWidget.editor.activeEffect()
    if activeEffect:
      activeName = slicer.modules.SegmentEditorWidget.editor.activeEffect().name
    else:
      activeName = None
    newIndex = (orderedNames.index(activeName) + delta) % len(orderedNames)
    slicer.modules.SegmentEditorWidget.editor.setActiveEffectByName(orderedNames[newIndex])
  except AttributeError:
    # module not active
    pass

shortcuts = [
  ("`", lambda: cycleEffect(-1)),
  ("~", lambda: cycleEffect(1)),
  ]

for (shortcutKey, callback) in shortcuts:
  shortcut = qt.QShortcut(slicer.util.mainWindow())
  shortcut.setKey(qt.QKeySequence(shortcutKey))
  shortcut.connect( "activated()", callback)
Customize keyboard/mouse gestures in viewers
Make the 3D view rotate using right-click-and-drag
threeDViewNode = slicer.mrmlScene.GetNodeByID("vtkMRMLViewNode1")
appLogic = slicer.app.applicationLogic()
cameraDisplayableManager = appLogic.GetViewDisplayableManagerByClassName(threeDViewNode, "vtkMRMLCameraDisplayableManager")
cameraWidget = cameraDisplayableManager.GetCameraWidget()

# Remove old mapping from right-click-and-drag
cameraWidget.SetEventTranslationClickAndDrag(cameraWidget.WidgetStateIdle, vtk.vtkCommand.RightButtonPressEvent, vtk.vtkEvent.NoModifier,
  cameraWidget.WidgetStateRotate, vtk.vtkWidgetEvent.NoEvent, vtk.vtkWidgetEvent.NoEvent)

# Make right-click-and-drag rotate the view
cameraWidget.SetEventTranslationClickAndDrag(cameraWidget.WidgetStateIdle, vtk.vtkCommand.RightButtonPressEvent, vtk.vtkEvent.NoModifier,
  cameraWidget.WidgetStateRotate, cameraWidget.WidgetEventRotateStart, cameraWidget.WidgetEventRotateEnd)
Custom shortcut for moving crosshair in a slice view
# Red slice view
sliceViewLabel = "Red"
sliceViewNode = slicer.mrmlScene.GetNodeByID(f"vtkMRMLSliceNode{sliceViewLabel}")
appLogic = slicer.app.applicationLogic()
displayableManager = appLogic.GetViewDisplayableManagerByClassName(sliceViewNode, "vtkMRMLCrosshairDisplayableManager")

widget = displayableManager.GetSliceIntersectionWidget()

# Set crosshair position by left-click
widget.SetEventTranslation(widget.WidgetStateIdle, slicer.vtkMRMLInteractionEventData.LeftButtonClickEvent, vtk.vtkEvent.NoModifier, widget.WidgetEventSetCrosshairPosition)
widget.SetEventTranslation(widget.WidgetStateIdle, slicer.vtkMRMLInteractionEventData.LeftButtonClickEvent, vtk.vtkEvent.NoModifier, widget.WidgetEventSetCrosshairPosition)

# Move crosshair by Alt+left-click-and-drag
widget.SetEventTranslationClickAndDrag(widget.WidgetStateIdle, vtk.vtkCommand.LeftButtonPressEvent, vtk.vtkEvent.AltModifier,
  widget.WidgetStateMoveCrosshair, widget.WidgetEventMoveCrosshairStart, widget.WidgetEventMoveCrosshairEnd)
Custom shortcut for moving crosshair in a 3D view
# 3D view
threeDViewNode = slicer.mrmlScene.GetNodeByID("vtkMRMLViewNode1")
appLogic = slicer.app.applicationLogic()
cameraDisplayableManager = appLogic.GetViewDisplayableManagerByClassName(threeDViewNode, "vtkMRMLCameraDisplayableManager")
widget = cameraDisplayableManager.GetCameraWidget()

# Set crosshair position by left-click
widget.SetEventTranslation(widget.WidgetStateIdle, slicer.vtkMRMLInteractionEventData.LeftButtonClickEvent, vtk.vtkEvent.NoModifier, widget.WidgetEventSetCrosshairPosition)

# Move crosshair by Alt+left-click-and-drag
widget.SetEventTranslationClickAndDrag(widget.WidgetStateIdle, vtk.vtkCommand.LeftButtonPressEvent, vtk.vtkEvent.AltModifier,
  widget.WidgetStateMoveCrosshair, widget.WidgetEventMoveCrosshairStart, widget.WidgetEventMoveCrosshairEnd)
Add shortcut to adjust window/level in any mouse mode
Makes Ctrl + Right-click-and-drag gesture adjust window/level in red slice view. This gesture works even when not in “Adjust window/level” mouse mode.
sliceViewLabel = "Red"
sliceViewNode = slicer.mrmlScene.GetNodeByID(f"vtkMRMLSliceNode{sliceViewLabel}")
appLogic = slicer.app.applicationLogic()
displayableManager = appLogic.GetViewDisplayableManagerByClassName(sliceViewNode, "vtkMRMLScalarBarDisplayableManager")
w = displayableManager.GetWindowLevelWidget()
w.SetEventTranslationClickAndDrag(w.WidgetStateIdle,
  vtk.vtkCommand.RightButtonPressEvent, vtk.vtkEvent.ControlModifier,
  w.WidgetStateAdjustWindowLevel, w.WidgetEventAlwaysOnAdjustWindowLevelStart, w.WidgetEventAlwaysOnAdjustWindowLevelEnd)
Disable certain user interactions in slice views
For example, disable slice browsing using mouse wheel and keyboard shortcuts in the red slice viewer:
interactorObserver = slicer.app.layoutManager().sliceWidget("Red").sliceView().interactorObserver()
interactorObserver.SetActionEnabled(interactorStyle.BrowseSlice, False)
Hide all slice view controllers:
lm = slicer.app.layoutManager()
for sliceViewName in lm.sliceViewNames():
  lm.sliceWidget(sliceViewName).sliceController().setVisible(False)
Hide all 3D view controllers:
lm = slicer.app.layoutManager()
for viewIndex in range(slicer.app.layoutManager().threeDViewCount):
  lm.threeDWidget(0).threeDController().setVisible(False)
Add keyboard shortcut to jump to center or world coordinate system
You can copy-paste this into the Python console to jump slice views to (0,0,0) position on (Ctrl+e):
shortcut = qt.QShortcut(qt.QKeySequence("Ctrl+e"), slicer.util.mainWindow())
shortcut.connect("activated()",
  lambda: slicer.modules.markups.logic().JumpSlicesToLocation(0,0,0, True))
Launch external applications
How to run external applications from Slicer.
Launch external process in startup environment
When a process is launched from Slicer then by default Slicer”s ITK, VTK, Qt, etc. libraries are used. If an external application has its own version of these libraries, then the application is expected to crash. To prevent crashing, the application must be run in the environment where Slicer started up (without all Slicer-specific library paths). This startup environment can be retrieved using slicer.util.startupEnvironment().
Example: run Python3 script from Slicer:
command_to_execute = ["/usr/bin/python3", "-c", "print("hola")"]
from subprocess import check_output
check_output(
  command_to_execute,
  env=slicer.util.startupEnvironment()
  )
will output:
"hola\n"
On some systems, shell=True must be specified as well.
Manage extensions
Download and install extension
Added in version 5.4: Slicer introduces slicer.app.installExtensionFromServer(), which
simplifies the process of downloading and installing extensions. The updated
approach is as follows:
extensionName = 'SlicerIGT'
em = slicer.app.extensionsManagerModel()
em.interactive = False  # prevent display of popups
restart = True
if not em.installExtensionFromServer(extensionName, restart):
  raise ValueError(f"Failed to install {extensionName} extension")
Install a module directly from a git repository
This code snippet can be useful for sharing code in development without requiring a restart of Slicer.
Install a Python package
It is recommended to only install a package at runtime when it is actually needed (not at startup, not even when the user opens a module, but just before that Python package is used the first time), and ask the user about it. For more comprehensive guidelines, refer to the best practices.
Recommended approach using pip_ensure
Added in version 5.11: The slicer.packaging module and the pip_ensure workflow described below.
The slicer.packaging.pip_ensure() function handles checking, prompting, and installing in one call with a progress dialog:
import slicer.packaging

class MyModuleWidget(ScriptedLoadableModuleWidget):

    def onApplyButton(self):
        # For a single package (or space-separated list):
        slicer.packaging.pip_ensure("flywheel-sdk>=1.0", requester="MyModule")

        # Or load requirements from file (recommended for multiple dependencies):
        # reqs = slicer.packaging.load_requirements(self.resourcePath("requirements.txt"))
        # slicer.packaging.pip_ensure(reqs, requester="MyModule")

        import flywheel
        # Now safe to use flywheel
Key features of pip_ensure():
Shows a confirmation dialog before installing (controlled by
prompt_install, defaultTrue)Shows a progress dialog during installation with collapsible log details
Detects when an updated package was already imported in the current session and offers a restart prompt (controlled by
prompt_restart, defaultTrue)Automatically skips installation in testing mode (
slicer.app.testingEnabled())
Alternative: pip_install with progress dialog
For direct installation with visual feedback without using pip_ensure. Note that pip_install
now shows a progress dialog by default:
try:
  import flywheel
except ModuleNotFoundError:
  if slicer.util.confirmOkCancelDisplay("This module requires 'flywheel-sdk' Python package. Click OK to install it now."):
    slicer.packaging.pip_install("flywheel-sdk", requester="MyModule")
    import flywheel
Simple approach (no progress dialog)
For scripting or automation where no visual feedback is needed:
try:
  import flywheel
except ModuleNotFoundError:
  if slicer.util.confirmOkCancelDisplay("This module requires 'flywheel-sdk' Python package. Click OK to install it now."):
    slicer.packaging.pip_install("flywheel-sdk", show_progress=False)
    import flywheel
Python package management
The slicer.packaging module provides functions for checking, installing, and managing Python
packages in the Slicer environment. For best practices on when and how to install packages,
see Can I use any Python package in a Slicer module?.
Added in version 5.11: The slicer.packaging module with pip_ensure, pip_check, load_requirements,
and load_pyproject_dependencies.
Tip
When writing a Slicer module, prefer slicer.packaging.pip_ensure() over
slicer.packaging.pip_install(). pip_ensure checks whether each requirement is already
satisfied (skipping the install if so), prompts the user before modifying the environment, and
detects when an updated package was already imported in the current session and offers a restart
prompt. pip_install is the lower-level building block and does none of those things on its own.
Check if packages are installed
Use pip_check to test whether requirements are already satisfied without launching a
subprocess:
import slicer.packaging

# Single requirement
if slicer.packaging.pip_check("scipy>=1.0"):
    print("scipy is available")

# Multiple requirements (space-separated)
if slicer.packaging.pip_check("scipy>=1.0 numpy>=1.20"):
    print("All available")

# Multiple requirements from a file
reqs = slicer.packaging.load_requirements("/path/to/requirements.txt")
if not slicer.packaging.pip_check(reqs):
    print("Some requirements are missing")
Load requirements from a file
You can keep your dependencies in a requirements.txt file and load them with
slicer.packaging.load_requirements():
reqs = slicer.packaging.load_requirements(self.resourcePath("requirements.txt"))
slicer.packaging.pip_ensure(reqs, requester="MyExtension")
If your extension already has a pyproject.toml, you can read the [project.dependencies] list with slicer.packaging.load_pyproject_dependencies() instead. Both functions return the same list[Requirement] type, so the rest of the pipeline (pip_check, pip_ensure) works identically:
reqs = slicer.packaging.load_pyproject_dependencies(self.resourcePath("pyproject.toml"))
slicer.packaging.pip_ensure(reqs, requester="MyExtension")
Install packages with a constraints file
A constraints file limits which versions pip may install without triggering installation on its own. This is useful for ensuring compatible versions across multiple extensions.
import slicer.packaging

# Via pip_ensure (recommended)
reqs = slicer.packaging.load_requirements("/path/to/requirements.txt")
slicer.packaging.pip_ensure(
    reqs,
    constraints="/path/to/constraints.txt",
    requester="MyExtension",
)
# Via pip_install (lower level)
slicer.packaging.pip_install("pandas scipy", constraints="/path/to/constraints.txt")
Install packages with broken dependency declarations
When a package declares overly strict dependencies that conflict with other packages,
use no_deps_requirements to install it without its declared dependencies, then
install the actual dependencies you need separately:
slicer.packaging.pip_install(
    requirements="numpy scipy",
    no_deps_requirements="problematic-pkg==1.0",
)
Excluding specific transitive dependencies (skip_packages)
skip_packages installs each requirement with --no-deps, walks its dependency
tree recursively, and excludes any package matching the skip list. Package METADATA
is scrubbed afterward so pip will not flag the skipped packages as missing.
It exists for the specific case where a package pulls in a transitive dependency
that Slicer already provides differently, such as SimpleITK (Slicer bundles a
custom build) or torch (must come from SlicerPyTorch for the correct CUDA/CPU
combination). Without skip_packages, installing such a package would overwrite
or conflict with Slicer’s bundled version.
import slicer.packaging

skipped = slicer.packaging.pip_ensure(
    "nnunetv2>=2.3",
    skip_packages=["SimpleITK", "torch", "requests"],
    requester="SlicerNNUNet",
)
# skipped contains the requirement strings that were excluded,
# e.g. ["torch>=2.0", "SimpleITK>=2.0.2", "requests"]
Warning
skip_packages is a workaround, not a recommended pattern. It hides
unwanted requirements from pip, which means real conflicts are no longer
reported and pip show no longer reflects the true dependency graph.
Skip lists also drift over time as Slicer’s bundled packages change.
Where possible, consider asking the upstream maintainer to relax the
unnecessary requirement, or use no_deps_requirements if the dependency
tree is small enough to enumerate yourself. For packages with deep
transitive dependency trees that conflict with Slicer’s bundled libraries
(e.g. nnUNet pulling in torch and SimpleITK), skip_packages is
often the only practical option short of forking the package – which is
why it exists.
skip_packages and no_deps_requirements are mutually exclusive.
Non-blocking package installation
Use blocking=False to install packages without blocking the UI. Pip output
appears in the status bar by default, and you can provide callbacks for custom handling:
def onComplete(returnCode):
    if returnCode == 0:
        import pandas  # Now safe to import
    else:
        slicer.util.errorDisplay("Failed to install packages")

slicer.packaging.pip_install(
    "pandas scipy",
    blocking=False,
    completedCallback=onComplete,
)
# Returns immediately — UI stays responsive
Warning
When using blocking=False, the user can interact with the application while
installation is in progress. Consider showing a modal dialog or disabling
relevant UI elements during installation to prevent conflicts.
Check if installation is in progress
Before starting an operation that might conflict with an ongoing pip installation, check the in-progress flag:
import slicer.packaging

if slicer.packaging.isPipInstallInProgress():
    slicer.util.warningDisplay("Package installation is in progress. Please wait.")
else:
    slicer.packaging.pip_install("scipy", blocking=False, requester="MyExtension")
DICOM
Load DICOM files into the scene from a folder
This code loads all DICOM objects into the scene from a file folder. All the registered plugins are evaluated and the one with the highest confidence will be used to load the data. Files are imported into a temporary DICOM database, so the current Slicer DICOM database is not impacted.
dicomDataDir = "c:/my/folder/with/dicom-files"  # input folder with DICOM files
loadedNodeIDs = []  # this list will contain the list of all loaded node IDs

from DICOMLib import DICOMUtils
with DICOMUtils.TemporaryDICOMDatabase() as db:
  DICOMUtils.importDicom(dicomDataDir, db)
  patientUIDs = db.patients()
  for patientUID in patientUIDs:
    loadedNodeIDs.extend(DICOMUtils.loadPatientByUID(patientUID))
Import DICOM files into the application’s DICOM database
This code snippet uses Slicer DICOM browser built-in indexer to import DICOM files into the database. Images are not loaded into the scene, but they show up in the DICOM browser. After import, data sets can be loaded using DICOMUtils functions (e.g., loadPatientByUID) - see above for an example.
# instantiate a new DICOM browser
slicer.util.selectModule("DICOM")
dicomBrowser = slicer.modules.DICOMWidget.browserWidget.dicomBrowser
# use dicomBrowser.ImportDirectoryCopy to make a copy of the files (useful for importing data from removable storage)
dicomBrowser.importDirectory(dicomFilesDirectory, dicomBrowser.ImportDirectoryAddLink)
# wait for import to finish before proceeding (optional, if removed then import runs in the background)
dicomBrowser.waitForImportFinished()
Import DICOM files using DICOMweb
Download and import DICOM data set using DICOMweb from a Picture Archiving and Communications System (PACS) such as Kheops, Google Health API, Orthanc, DCM4CHE, etc.
slicer.util.selectModule("DICOM")  # ensure DICOM database is initialized
slicer.app.processEvents()
from DICOMLib import DICOMUtils
DICOMUtils.importFromDICOMWeb(
  dicomWebEndpoint="https://demo.kheops.online/api",
  studyInstanceUID="1.3.6.1.4.1.14519.5.2.1.8421.4009.985792766370191766692237040819")
Authenticate with an Access Token
Several PACS solutions support remote access authentication with an access token.
How to obtain your access token:
Google Cloud: Execute
gcloud auth print-access-tokenonce you have logged inKheops: create an album, create a sharing link (something like
https://demo.kheops.online/view/TfYXwbKAW7JYbAgZ7MyISf), the token is the string after the last slash (TfYXwbKAW7JYbAgZ7MyISf).
slicer.util.selectModule("DICOM")  # ensure DICOM database is initialized and
slicer.app.processEvents()
from DICOMLib import DICOMUtils
DICOMUtils.importFromDICOMWeb(
  dicomWebEndpoint="https://demo.kheops.online/api",
  studyInstanceUID="1.3.6.1.4.1.14519.5.2.1.8421.4009.985792766370191766692237040819",
  accessToken="TfYXwbKAW7JYbAgZ7MyISf")
Alternate Authentication Approaches
You can provide expanded authentication information to use in the DICOMweb request.
Authentication types extending the Python requests.auth.AuthBase are accepted.
In the example below we provide a basic username and password as a requests.HTTPBasicAuth
instance with the DICOMweb import request.
DICOMUtils.importFromDICOMWeb(
  dicomWebEndpoint="https://demo.kheops.online/api",
  studyInstanceUID="1.3.6.1.4.1.14519.5.2.1.8421.4009.985792766370191766692237040819",
  auth=requests.HTTPBasicAuth('<user>','<password>'))
See the Python requests Authentication documentation
for more information.
Configure a Global DICOMweb Authentication
You can set a global username and password combination in your local Slicer application
to be remembered across application sessions. DICOMUtils.getGlobalDICOMAuth provides
a convenient way to create a HTTPBasicAuth instance from the global configuration
with each call.
qt.QSettings().setValue(DICOMUtils.GLOBAL_DICOMWEB_USER_KEY, '<user>')
qt.QSettings().setValue(DICOMUtils.GLOBAL_DICOMWEB_PASSWORD_KEY, '<pwd>')
DICOMUtils.importFromDICOMWeb(
  dicomWebEndpoint="https://remote-url/",
  studyInstanceUID="1.3.6.1.4.1.14519.5.2.1.8421.4009.985792766370191766692237040819",
  auth=DICOMUtils.getGlobalDICOMAuth()
)
Access tag of a scalar volume loaded from DICOM
Volumes loaded by DICOMScalarVolumePlugin store SOP Instance UIDs in the volume node’s DICOM.instanceUIDs attribute. For example, this can be used to get the patient position stored in a volume:
volumeName = "2: ENT IMRT"
volumeNode = slicer.util.getNode(volumeName)
instUids = volumeNode.GetAttribute("DICOM.instanceUIDs").split()
filename = slicer.dicomDatabase.fileForInstance(instUids[0])
print(slicer.dicomDatabase.fileValue(filename, "0018,5100"))  # patient position
Access tag of an item in the Subject Hierarchy tree
Data sets loaded by various DICOM plugins may not use DICOM.instanceUIDs attribute but instead they save the Series Instance UID to the subject hierarchy item. The SOP Instance UIDs can be retrieved based on the series instance UID, which then can be used to retrieve DICOM tags:
volumeName = "2: ENT IMRT"
volumeNode = slicer.util.getNode(volumeName)

# Get series instance UID from subject hierarchy
shNode = slicer.vtkMRMLSubjectHierarchyNode.GetSubjectHierarchyNode(slicer.mrmlScene)
volumeItemId = shNode.GetItemByDataNode(volumeNode)
seriesInstanceUID = shNode.GetItemUID(volumeItemId, 'DICOM')

# Get patient name (0010,0010) from the first file of the series
instUids = slicer.dicomDatabase.instancesForSeries(seriesInstanceUID)
print(slicer.dicomDatabase.instanceValue(instUids[0], '0010,0010')) # patient name
Another example, using referenced instance UIDs to get the content time tag of a structure set:
rtStructName = "3: RTSTRUCT: PROS"
rtStructNode = slicer.util.getNode(rtStructName)
shNode = slicer.vtkMRMLSubjectHierarchyNode.GetSubjectHierarchyNode(slicer.mrmlScene)
rtStructShItemID = shNode.GetItemByDataNode(rtStructNode)
ctSliceInstanceUids = shNode.GetItemAttribute(rtStructShItemID, "DICOM.ReferencedInstanceUIDs").split()
filename = slicer.dicomDatabase.fileForInstance(ctSliceInstanceUids[0])
print(slicer.dicomDatabase.fileValue(filename, "0008,0033"))  # content time
Get path and filename of a scalar volume node loaded from DICOM
def pathFromNode(node):
  storageNode = node.GetStorageNode()
  if storageNode is not None: # loaded via drag-drop
    filepath = storageNode.GetFullNameFromFileName()
  else: # Loaded via DICOM browser
    instanceUIDs = node.GetAttribute("DICOM.instanceUIDs").split()
    filepath = slicer.dicomDatabase.fileForInstance(instanceUIDs[0])
  return filepath

# Example:
node = slicer.util.getNode("volume1")
path = pathFromNode(node)
print("DICOM path=%s" % path)
Convert DICOM to NRRD on the command line
/Applications/Slicer-4.6.2.app/Contents/MacOS/Slicer --no-main-window --python-code "node=slicer.util.loadVolume('/tmp/series/im0.dcm'); slicer.util.saveNode(node, '/tmp/output.nrrd'); exit()"
The same can be done on windows by using the top level Slicer.exe. Be sure to use forward slashes in the pathnames within quotes on the command line.
Export a volume to DICOM file format
volumeNode = getNode("CTChest")
outputFolder = "c:/tmp/dicom-output"

# Create patient and study and put the volume under the study
shNode = slicer.vtkMRMLSubjectHierarchyNode.GetSubjectHierarchyNode(slicer.mrmlScene)
# set IDs. Note: these IDs are not specifying DICOM tags, but only the names that appear in the hierarchy tree
patientItemID = shNode.CreateSubjectItem(shNode.GetSceneItemID(), "test patient")
studyItemID = shNode.CreateStudyItem(patientItemID, "test study")
volumeShItemID = shNode.GetItemByDataNode(volumeNode)
shNode.SetItemParent(volumeShItemID, studyItemID)

import DICOMScalarVolumePlugin
exporter = DICOMScalarVolumePlugin.DICOMScalarVolumePluginClass()
exportables = exporter.examineForExport(volumeShItemID)
for exp in exportables:
  # set output folder
  exp.directory = outputFolder
  # here we set DICOM PatientID and StudyID tags
  exp.setTag('PatientID', "test patient")
  exp.setTag('StudyID', "test study")

exporter.export(exportables)
Export a segmentation to DICOM segmentation object
segmentationNode = ...
referenceVolumeNode = ...
outputFolder = "c:/tmp/dicom-output"

# Associate segmentation node with a reference volume node
shNode = slicer.vtkMRMLSubjectHierarchyNode.GetSubjectHierarchyNode(slicer.mrmlScene)
referenceVolumeShItem = shNode.GetItemByDataNode(referenceVolumeNode)
studyShItem = shNode.GetItemParent(referenceVolumeShItem)
segmentationShItem = shNode.GetItemByDataNode(segmentationNode)
shNode.SetItemParent(segmentationShItem, studyShItem)

# Export to DICOM
import DICOMSegmentationPlugin
exporter = DICOMSegmentationPlugin.DICOMSegmentationPluginClass()
exportables = exporter.examineForExport(segmentationShItem)
for exp in exportables:
  exp.directory = outputFolder

exporter.export(exportables)
Export DICOM series from the database to research file format
You can export the entire Slicer DICOM database content to nrrd (or nifti, etc.) file format with filtering of data type and naming of the output file based on DICOM tags like this:
outputFolder = "c:/tmp/exptest/"

from DICOMLib import DICOMUtils
patientUIDs = slicer.dicomDatabase.patients()
for patientUID in patientUIDs:
    loadedNodeIDs = DICOMUtils.loadPatientByUID(patientUID)
    for loadedNodeID in loadedNodeIDs:
        # Check if we want to save this node
        node = slicer.mrmlScene.GetNodeByID(loadedNodeID)
        # Only export images
        if not node or not node.IsA('vtkMRMLScalarVolumeNode'):
            continue
        # Construct filename
        shNode = slicer.mrmlScene.GetSubjectHierarchyNode()
        seriesItem = shNode.GetItemByDataNode(node)
        studyItem = shNode.GetItemParent(seriesItem)
        patientItem = shNode.GetItemParent(studyItem)
        filename = shNode.GetItemAttribute(patientItem, 'DICOM.PatientID')
        filename += '_' + shNode.GetItemAttribute(studyItem, 'DICOM.StudyDate')
        filename += '_' + shNode.GetItemAttribute(seriesItem, 'DICOM.SeriesNumber')
        filename += '_' + shNode.GetItemAttribute(seriesItem, 'DICOM.Modality')
        filename = slicer.app.ioManager().forceFileNameValidCharacters(filename) + ".nrrd"
        # Save node
        print(f'Write {node.GetName()} to {filename}')
        success = slicer.util.saveNode(node, outputFolder+filename)
    slicer.mrmlScene.Clear()
Customize table columns in DICOM browser
Documentation of methods for changing DICOM browser columns: https://github.com/commontk/CTK/blob/master/Libs/DICOM/Core/ctkDICOMDatabase.h#L354-L375
# Get browser and database
dicomBrowser = slicer.modules.dicom.widgetRepresentation().self().browserWidget.dicomBrowser
dicomDatabase = dicomBrowser.database()

# Print list of available columns
print(dicomDatabase.patientFieldNames)
print(dicomDatabase.studyFieldNames)
print(dicomDatabase.seriesFieldNames)

# Change column order
dicomDatabase.setWeightForField("Series", "SeriesDescription", 7)
dicomDatabase.setWeightForField("Studies", "StudyDescription", 6)
# Change column visibility
dicomDatabase.setVisibilityForField("Patients", "PatientsBirthDate", False)
dicomDatabase.setVisibilityForField("Patients", "PatientsComments", True)
dicomDatabase.setWeightForField("Patients", "PatientsComments", 8)
# Change column name
dicomDatabase.setDisplayedNameForField("Series", "DisplayedCount", "Number of images")
# Change column width to manual
dicomDatabase.setFormatForField("Series", "SeriesDescription", '{"resizeMode":"interactive"}')
# Customize table manager in DICOM browser
dicomTableManager = dicomBrowser.dicomTableManager()
dicomTableManager.selectionMode = qt.QAbstractItemView.SingleSelection
dicomTableManager.autoSelectSeries = False

# Force database views update
dicomDatabase.closeDatabase()
dicomDatabase.openDatabase(dicomBrowser.database().databaseFilename)
Query and retrieve data from a PACS using classic DIMSE DICOM networking
# Query
dicomQuery = ctk.ctkDICOMQuery()
dicomQuery.callingAETitle = "SLICER"
dicomQuery.calledAETitle = "ANYAE"
dicomQuery.host = "dicomserver.co.uk"
dicomQuery.port = 11112
# Change filter parameters in the next line if
# query does not find any series (try to use a different letter for "Name", such as "E")
# or there are too many hits (try to make "Name" more specific, such as "An").
dicomQuery.setFilters({"Name":"A", "Modalities":"MR"})
# temporary in-memory database for storing query results
tempDb = ctk.ctkDICOMDatabase()
tempDb.openDatabase("")
dicomQuery.query(tempDb)

# Retrieve
# Enable useCGET to retrieve using the query's connection (using C-GET).
# C-GET is simple, as it does not require configuring a DICOM receiver
# but C-GET is rarely allowed in clinical PACS.
# If useCGET is disabled then retrieve requests the PACS to send the data (using C-STORE)
# to Slicer. Slicer's AE title must be configured in the PACS settings. Slicer must have its
# DICOM receiver (C-STORE SCP) running.
useCGET = True
dicomRetrieve = ctk.ctkDICOMRetrieve()
dicomRetrieve.callingAETitle = dicomQuery.callingAETitle
dicomRetrieve.calledAETitle = dicomQuery.calledAETitle
dicomRetrieve.host = dicomQuery.host
dicomRetrieve.port = dicomQuery.port
dicomRetrieve.setDatabase(slicer.dicomDatabase)
for study, series in dicomQuery.studyAndSeriesInstanceUIDQueried:
  print(f"ctkDICOMRetrieveTest: Retrieving {study} - {series}")
  slicer.app.processEvents()
  if useCGET:
    success = dicomRetrieve.getSeries(study, series)
  else:
    dicomRetrieve.moveDestinationAETitle = dicomQuery.callingAETitle
    success = dicomRetrieve.moveSeries(study, series)
  print(f"  - {'success' if success else 'failed'}")

slicer.dicomDatabase.updateDisplayedFields()
Query and retrieve data from a PACS using classic DIMSE DICOM networking with the (experimental) ctkDICOMVisualBrowser
# Get visual browser instance
visualBrowser = slicer.modules.dicom.widgetRepresentation().self().browserWidget.dicomVisualBrowser
dicomDatabase = visualBrowser.dicomDatabase()

# Disable query/retrieve for all existing servers
for index in range (0, visualBrowser.serversCount()):
  server = visualBrowser.server(index)
  server.queryRetrieveEnabled = False

# Add a new DICOM server
server = ctk.ctkDICOMServer()
server.connectionName = "test"
server.callingAETitle = "SLICER"
server.calledAETitle = "ANYAE"
server.host = "dicomserver.co.uk"
server.port = 104
server.retrieveProtocol = ctk.ctkDICOMServer.CGET

if visualBrowser.addServer(server) == -1:
  raise RuntimeError("Failed to add server")

# Set the filters for the query
visualBrowser.filteringPatientID = "PAT020"
#visualBrowser.filteringPatientName = "Name"
#visualBrowser.filteringStudyDescription = "Study description"
visualBrowser.filteringDate = ctk.ctkDICOMPatientItemWidget.LastYear
#Date options:
#Any,
#Today,
#Yesterday,
#LastWeek,
#LastMonth,
#LastYear
#visualBrowser.filteringSeriesDescription = "Series description"
#visualBrowser.filteringModalities = ["CT", "MR"]

# Run patient query.
# NOTE: this will automatically also start query/retrieve jobs at study and series levels
visualBrowser.onQueryRetrieveOptionToggled(True)
visualBrowser.onQueryPatients()
Query and retrieve data from a PACS using classic DIMSE DICOM networking with the (experimental) ctkDICOMScheduler (no UI needed)
class Receiver(qt.QObject):
  def __init__(self, scheduler):
    super().__init__()
    self.scheduler = scheduler
    self.scheduler.progressJobDetail.connect(self.onProgressDetails)
    self.scheduler.jobFinished.connect(self.onJobFinished)
    self.scheduler.jobFailed.connect(self.onJobFailed)

  def startQueryRetrieve(self, parameters):
    self.scheduler.setFilters(parameters)
    self.scheduler.queryPatients()

  def onJobFinished(self, details):
    for detail in details:
      if detail.jobType() == ctk.ctkDICOMJobResponseSet.QueryPatients:
        print ("Query patients success. Connection : ", detail.connectionName())
      elif detail.jobType() == ctk.ctkDICOMJobResponseSet.QueryStudies:
        patientID = detail.patientID()
        print ("Query studies success for patientID: ", patientID, ". Connection : ", detail.connectionName())
      elif detail.jobType() == ctk.ctkDICOMJobResponseSet.RetrieveStudy:
        patientID = detail.patientID()
        studyInstanceUID = detail.studyInstanceUID()
        print ("Retrieve studies success for studyInstanceUID: ", studyInstanceUID, " (patientID: ",patientID, "). Connection : ", detail.connectionName())

  def onJobFailed(self, details):
    for detail in details:
      if detail.jobType() == ctk.ctkDICOMJobResponseSet.QueryPatients:
        print ("Query patients failed. Connection : ", detail.connectionName())
      elif detail.jobType() == ctk.ctkDICOMJobResponseSet.QueryStudies:
        patientID = detail.patientID()
        print ("Query studies failed for patientID: ", patientID, ". Connection : ", detail.connectionName())
      elif detail.jobType() == ctk.ctkDICOMJobResponseSet.RetrieveStudy:
        patientID = detail.patientID()
        studyInstanceUID = detail.studyInstanceUID()
        print ("Retrieve studies failed for studyInstanceUID: ", studyInstanceUID, " (patientID: ", patientID, "). Connection : ", detail.connectionName())

  def onProgressDetails(self, details):
    for detail in details:
      if detail.jobType() == ctk.ctkDICOMJobResponseSet.QueryPatients:
        patientIDs = detail.queriedPatientIDs()
        for patientID in patientIDs:
          print ("Starting studies query for patient: ", patientID, ". Connection : ", detail.connectionName())
          scheduler.queryStudies(patientID)
      elif detail.jobType() == ctk.ctkDICOMJobResponseSet.QueryStudies:
        studyInstanceUIDs = detail.queriedStudyInstanceUIDs()
        for studyInstanceUID in studyInstanceUIDs:
          patientItem = slicer.dicomDatabase.patientForStudy(studyInstanceUID)
          patientID = slicer.dicomDatabase.fieldForPatient("PatientID", patientItem)
          print ("Starting studies retrieve for studyInstanceUID: ", studyInstanceUID, " (patientID: ",patientID, "). Connection : ", detail.connectionName())
          scheduler.retrieveStudy(patientID, studyInstanceUID)


# Add a new DICOM server
server = ctk.ctkDICOMServer()
server.connectionName = "test"
server.callingAETitle = "SLICER"
server.calledAETitle = "ANYAE"
server.host = "dicomserver.co.uk"
server.port = 104
server.retrieveProtocol = ctk.ctkDICOMServer.CGET

scheduler = ctk.ctkDICOMScheduler()
scheduler.setDicomDatabase(slicer.dicomDatabase)
scheduler.addServer(server)

receiver = Receiver(scheduler)

# Set the filters for the query
nDays = 325
endDate = qt.QDate().currentDate()
startDate = endDate.addDays(-nDays)
parameters = {
  "ID": "PAT020",
  #"Name": "Name",
  #"Study": "Study description",
  #"Series": "Series description",
  #"Modalities": ["CT", "MR"],
  "StartDate": startDate.toString("yyyyMMdd"),
  "EndDate": endDate.toString("yyyyMMdd")
}

receiver.startQueryRetrieve(parameters)
Send data to a PACS using classic DIMSE DICOM networking
from DICOMLib import DICOMSender
sender = DICOMSender(
  files=['path/to/0.dcm','path/to/1.dcm'],
  address='dicomserver.co.uk:9999'
  protocol="DIMSE",
  delayed=True
)
sender.send()
Send data to a PACS using DICOMweb networking
from DICOMLib import DICOMSender
sender = DICOMSender(
  files=['path/to/0.dcm','path/to/1.dcm'],
  address='dicomserver.co.uk:9999'
  protocol="DICOMweb",
  auth=DICOMUtils.getGlobalDICOMAuth(),
  delayed=True
)
sender.send()
Convert RT structure set to labelmap NRRD files
SlicerRT batch processing to batch convert RT structure sets to labelmap NRRD files.
Run a DCMTK Command Line Tool
The example below runs the DCMTK img2dcm tool to convert a PNG input image to
an output DICOM file on disk. img2dcm runs in a separate process and Slicer
waits until it completes before continuing.
See DCMTK documentation for descriptions of other DCMTK command line application tools.
from DICOMLib import DICOMCommand
command = DICOMCommand('img2dcm',['image.png','output.dcm'])
stdout = command.start() # run synchronously, block until img2dcm returns
Additional Notes
See the DICOMLib scripted module for additional DICOM utilities.
Markups
Save markups to file
Any markup node can be saved as a markups json file:
markupsNode = slicer.util.getNode('F')
slicer.util.saveNode(markupsNode, "/path/to/MyMarkups.mrk.json")
Generally the markups json file format is recommended for saving all properties of a markups node, but for exporting only control point information (name, position, and basic state) a control points table can be exported in standard csv file format:
slicer.modules.markups.logic().ExportControlPointsToCSV(markupsNode, "/path/to/MyControlPoints.csv")
Load markups from file
Any markup node can be loaded from a markups json file:
markupsNode = slicer.util.loadMarkups("/path/to/MyMarkups.mrk.json")
Control points can be loaded from control points table csv file:
markupsNode = slicer.mrmlScene.AddNewNodeByClass("vtkMRMLMarkupsCurveNode")
slicer.modules.markups.logic().ImportControlPointsFromCSV(markupsNode, "/path/to/MyControlPoints.csv")
Load markups point list from file
Markups point list can be loaded from legacy fcsv file format. Note that this file format is no longer recommended, as it is not a standard csv file format and can only store a small fraction of information that is in a markups node.
slicer.util.loadMarkups("/path/to/list/F.fcsv")
Adding control points Programmatically
Markups control points can be added to the currently active point list from the python console by using the following module logic command:
slicer.modules.markups.logic().AddControlPoint()
The command with no arguments will place a new control point at the origin. You can also pass it an initial location:
slicer.modules.markups.logic().AddControlPoint(1.0, -2.0, 3.3)
How to draw a curve using control points stored in a numpy array
# Create random numpy array to use as input
import numpy as np
pointPositions = np.random.uniform(-50,50,size=[15,3])

# Create curve from numpy array
curveNode = slicer.mrmlScene.AddNewNodeByClass("vtkMRMLMarkupsCurveNode")
slicer.util.updateMarkupsControlPointsFromArray(curveNode, pointPositions)
Adding control points via mouse clicks
You can also set the mouse mode into Markups control point placement by calling:
placeModePersistence = 1
slicer.modules.markups.logic().StartPlaceMode(placeModePersistence)
A lower level way to do this is via the selection and interaction nodes:
selectionNode = slicer.mrmlScene.GetNodeByID("vtkMRMLSelectionNodeSingleton")
selectionNode.SetReferenceActivePlaceNodeClassName("vtkMRMLMarkupsFiducialNode")
interactionNode = slicer.mrmlScene.GetNodeByID("vtkMRMLInteractionNodeSingleton")
placeModePersistence = 1
interactionNode.SetPlaceModePersistence(placeModePersistence)
# mode 1 is Place, can also be accessed via slicer.vtkMRMLInteractionNode().Place
interactionNode.SetCurrentInteractionMode(1)
To switch back to view transform once you’re done placing control points:
interactionNode = slicer.mrmlScene.GetNodeByID("vtkMRMLInteractionNodeSingleton")
interactionNode.SwitchToViewTransformMode()
# also turn off place mode persistence if required
interactionNode.SetPlaceModePersistence(0)
Access to markups point list Properties
Each vtkMRMLMarkupsFiducialNode has a vector of control points in it which can be accessed from python:
pointListNode = getNode("vtkMRMLMarkupsFiducialNode1")
n = pointListNode.AddControlPoint([4.0, 5.5, -6.0])
pointListNode.SetNthControlPointLabel(n, "new label")
# each control point is given a unique id which can be accessed from the superclass level
id1 = pointListNode.GetNthControlPointID(n)
# manually set the position
pointListNode.SetNthControlPointPosition(n, 6.0, 7.0, 8.0)
# set the label
pointListNode.SetNthControlPointLabel(n, "New label")
# set the selected flag, only selected = 1 control points will be passed to CLIs
pointListNode.SetNthControlPointSelected(n, 1)
# set the visibility flag
pointListNode.SetNthControlPointVisibility(n, 0)
You can loop over the control points in a list and get the coordinates:
pointListNode = slicer.util.getNode("F")
numControlPoints = pointListNode.GetNumberOfControlPoints()
for i in range(numControlPoints):
  ras = vtk.vtkVector3d(0,0,0)
  pointListNode.GetNthControlPointPosition(i,ras)
  # the world position is the RAS position with any transform matrices applied
  world = [0.0, 0.0, 0.0]
  pointListNode.GetNthControlPointPositionWorld(i,world)
  print(i,": RAS =",ras,", world =",world)
You can also look at the sample code in the Endoscopy module to see how python is used to access control points from a scripted module.
Define/edit a circular region of interest in a slice viewer
Drop two markups control points on a slice view and copy-paste the code below into the Python console. After this, as you move the control points you’ll see a circle following the markups.
# Update the sphere from the control points
def UpdateSphere(param1, param2):
  """Update the sphere from the control points
  """
  import math
  pointListNode = slicer.util.getNode("F")
  centerPointCoord = [0.0, 0.0, 0.0]
  pointListNode.GetNthControlPointPosition(0,centerPointCoord)
  circumferencePointCoord = [0.0, 0.0, 0.0]
  pointListNode.GetNthControlPointPosition(1,circumferencePointCoord)
  sphere.SetCenter(centerPointCoord)
  radius=math.sqrt((centerPointCoord[0]-circumferencePointCoord[0])**2+(centerPointCoord[1]-circumferencePointCoord[1])**2+(centerPointCoord[2]-circumferencePointCoord[2])**2)
  sphere.SetRadius(radius)
  sphere.SetPhiResolution(30)
  sphere.SetThetaResolution(30)
  sphere.Update()

# Get point list node from scene
pointListNode = slicer.util.getNode("F")
sphere = vtk.vtkSphereSource()
UpdateSphere(0,0)

# Create model node and add to scene
modelsLogic = slicer.modules.models.logic()
model = modelsLogic.AddModel(sphere.GetOutput())
model.GetDisplayNode().SetSliceIntersectionVisibility(True)
model.GetDisplayNode().SetSliceIntersectionThickness(3)
model.GetDisplayNode().SetColor(1,1,0)

# Call UpdateSphere whenever the control points are changed
pointListNode.AddObserver(slicer.vtkMRMLMarkupsNode.PointModifiedEvent, UpdateSphere, 2)
Specify a sphere by multiple control points
Drop multiple markups control points at the boundary of the spherical object and and copy-paste the code below into the Python console to get best-fit sphere. A minimum of 4 control points are required. Tt is recommended to place the control points far away from each other for the most accurate fit.
# Get markup node from scene
pointListNode = slicer.util.getNode("F")

from scipy.optimize import least_squares
import numpy

def fit_sphere_least_squares(x_values, y_values, z_values, initial_parameters, bounds=((-numpy.inf, -numpy.inf, -numpy.inf, -numpy.inf),(numpy.inf, numpy.inf, numpy.inf, numpy.inf))):
  """
  Source: https://github.com/thompson318/scikit-surgery-sphere-fitting/blob/master/sksurgeryspherefitting/algorithms/sphere_fitting.py
  Uses scipy's least squares optimisor to fit a sphere to a set
  of 3D Points
  :return: x: an array containing the four fitted parameters
  :return: ier: int An integer flag. If it is equal to 1, 2, 3 or 4, the
          solution was found.
  :param: (x,y,z) three arrays of equal length containing the x, y, and z
          coordinates.
  :param: an array containing four initial values (centre, and radius)
  """
  return least_squares(_calculate_residual_sphere, initial_parameters, bounds=bounds, method="trf", jac="3-point", args=(x_values, y_values, z_values))

def _calculate_residual_sphere(parameters, x_values, y_values, z_values):
  """
  Source: https://github.com/thompson318/scikit-surgery-sphere-fitting/blob/master/sksurgeryspherefitting/algorithms/sphere_fitting.py
  Calculates the residual error for an x,y,z coordinates, fitted
  to a sphere with centre and radius defined by the parameters tuple
  :return: The residual error
  :param: A tuple of the parameters to be optimised, should contain [x_centre, y_centre, z_centre, radius]
  :param: arrays containing the x,y, and z coordinates.
  """
  #extract the parameters
  x_centre, y_centre, z_centre, radius = parameters
  #use numpy's sqrt function here, which works by element on arrays
  distance_from_centre = numpy.sqrt((x_values - x_centre)**2 + (y_values - y_centre)**2 + (z_values - z_centre)**2)
  return distance_from_centre - radius

# Fit a sphere to the markups fidicual points
markupsPositions = slicer.util.arrayFromMarkupsControlPoints(pointListNode)
import numpy as np
# initial guess
center0 = np.mean(markupsPositions, 0)
radius0 = np.linalg.norm(np.amin(markupsPositions,0)-np.amax(markupsPositions,0))/2.0
fittingResult = fit_sphere_least_squares(markupsPositions[:,0], markupsPositions[:,1], markupsPositions[:,2], [center0[0], center0[1], center0[2], radius0])
[centerX, centerY, centerZ, radius] = fittingResult["x"]

# Create a sphere using the fitted parameters
sphere = vtk.vtkSphereSource()
sphere.SetPhiResolution(30)
sphere.SetThetaResolution(30)
sphere.SetCenter(centerX, centerY, centerZ)
sphere.SetRadius(radius)
sphere.Update()

# Add the sphere to the scene
modelsLogic = slicer.modules.models.logic()
model = modelsLogic.AddModel(sphere.GetOutput())
model.GetDisplayNode().SetSliceIntersectionVisibility(True)
model.GetDisplayNode().SetSliceIntersectionThickness(3)
model.GetDisplayNode().SetColor(1,1,0)
Fit markups ROI to volume
This code snippet creates a new markups ROI and fits it to a volume node.
volumeNode = getNode('MRHead')

# Create a new ROI that will be fit to volumeNode
roiNode = slicer.mrmlScene.AddNewNodeByClass("vtkMRMLMarkupsROINode")

cropVolumeParameters = slicer.mrmlScene.AddNewNodeByClass("vtkMRMLCropVolumeParametersNode")
cropVolumeParameters.SetInputVolumeNodeID(volumeNode.GetID())
cropVolumeParameters.SetROINodeID(roiNode.GetID())
slicer.modules.cropvolume.logic().SnapROIToVoxelGrid(cropVolumeParameters)  # optional (rotates the ROI to match the volume axis directions)
slicer.modules.cropvolume.logic().FitROIToInputVolume(cropVolumeParameters)
slicer.mrmlScene.RemoveNode(cropVolumeParameters)
Fit markups plane to model
This code snippet fits a plane a model node named InputModel and creates a new markups plane node to display this best fit plane.
inputModel = getNode('InputModel')

# Compute best fit plane
center = [0.0, 0.0, 0.0]
normal = [0.0, 0.0, 1.0]
vtk.vtkPlane.ComputeBestFittingPlane(inputModel.GetPolyData().GetPoints(), center, normal)

# Display best fit plane as a markups plane
planeNode = slicer.mrmlScene.AddNewNodeByClass('vtkMRMLMarkupsPlaneNode')
planeNode.SetCenter(center)
planeNode.SetNormal(normal)
Measure angle between two markup planes
Measure angle between two markup plane nodes. Whenever any of the plane nodes are moved, the updated angle is printed on the console.
planeNodeNames = ["P", "P_1"]

# Print angles between slice nodes
def ShowAngle(unused1=None, unused2=None):
  planeNormalVectors = []
  for planeNodeName in planeNodeNames:
    planeNode = slicer.util.getFirstNodeByClassByName("vtkMRMLMarkupsPlaneNode", planeNodeName)
    planeNormalVector = [0.0, 0.0, 0.0]
    planeNode.GetNormalWorld(planeNormalVector)
    planeNormalVectors.append(planeNormalVector)
  angleRad = vtk.vtkMath.AngleBetweenVectors(planeNormalVectors[0], planeNormalVectors[1])
  angleDeg = vtk.vtkMath.DegreesFromRadians(angleRad)
  print("Angle between planes {0} and {1} = {2:0.3f}".format(planeNodeNames[0], planeNodeNames[1], angleDeg))

# Observe plane node changes
for planeNodeName in planeNodeNames:
  planeNode = slicer.util.getFirstNodeByClassByName("vtkMRMLMarkupsPlaneNode", planeNodeName)
  planeNode.AddObserver(slicer.vtkMRMLMarkupsPlaneNode.PointModifiedEvent, ShowAngle)

# Print current angle
ShowAngle()
Measure angle between two markup lines
Measure angle between two markup line nodes that are already added to the scene and have the names L and L_1. Whenever either line is moved, the updated angle is printed on the console. This is for illustration only, for standard angle measurements angle markups can be used.
lineNodeNames = ["L", "L_1"]

# Print angles between slice nodes
def ShowAngle(unused1=None, unused2=None):
  import numpy as np
  lineDirectionVectors = []
  for lineNodeName in lineNodeNames:
    lineNode = slicer.util.getFirstNodeByClassByName("vtkMRMLMarkupsLineNode", lineNodeName)
    lineStartPos = np.zeros(3)
    lineEndPos = np.zeros(3)
    lineNode.GetNthControlPointPositionWorld(0, lineStartPos)
    lineNode.GetNthControlPointPositionWorld(1, lineEndPos)
    lineDirectionVector = (lineEndPos-lineStartPos)/np.linalg.norm(lineEndPos-lineStartPos)
    lineDirectionVectors.append(lineDirectionVector)
  angleRad = vtk.vtkMath.AngleBetweenVectors(lineDirectionVectors[0], lineDirectionVectors[1])
  angleDeg = vtk.vtkMath.DegreesFromRadians(angleRad)
  print("Angle between lines {0} and {1} = {2:0.3f}".format(lineNodeNames[0], lineNodeNames[1], angleDeg))

# Observe line node changes
for lineNodeName in lineNodeNames:
  lineNode = slicer.util.getFirstNodeByClassByName("vtkMRMLMarkupsLineNode", lineNodeName)
  lineNode.AddObserver(slicer.vtkMRMLMarkupsLineNode.PointModifiedEvent, ShowAngle)

# Print current angle
ShowAngle()
Project a line to a plane
Create a new line (projectedLineNode) by projecting a line (lineNode) to a plane (planeNode).
Each control point is projected by computing coordinates in the plane coordinate system, zeroing the z coordinate (distance from plane) then transforming back the coordinates to the world coordinate system.
Transformation require homogeneous coordinates (1.0 appended to the 3D position), therefore 1.0 is added to the position after getting from the line and the 1.0 is removed when the computed point is added to the output line.
lineNode = getNode('L')
planeNode = getNode('P')

# Create new node for storing the projected line node
projectedLineNode = slicer.mrmlScene.AddNewNodeByClass(lineNode.GetClassName(), lineNode.GetName()+" projected")

# Get transforms
planeToWorld = vtk.vtkMatrix4x4()
planeNode.GetObjectToWorldMatrix(planeToWorld)
worldToPlane = vtk.vtkMatrix4x4()
vtk.vtkMatrix4x4.Invert(planeToWorld, worldToPlane)

# Project each point
for pointIndex in range(2):
    point_World = [*lineNode.GetNthControlPointPositionWorld(pointIndex), 1.0]
    point_Plane = worldToPlane.MultiplyPoint(point_World)
    projectedPoint_Plane = [point_Plane[0], point_Plane[1], 0.0, 1.0]
    projectedPoint_World = planeToWorld.MultiplyPoint(projectedPoint_Plane)
    projectedLineNode.AddControlPoint(projectedPoint_World[0:3])
Measure distances of points from a plane
Place a plane (P) and add points to point list (F) using Markups module in a view and then run the following code snippet to compute distances of the points from the plane.
pointListNode = getNode('F')
planeNode = getNode('P')

# Get transformation that gets point coordinates relative to the plane
planeToWorld = vtk.vtkMatrix4x4()
planeNode.GetObjectToWorldMatrix(planeToWorld)
worldToPlane = vtk.vtkMatrix4x4()
vtk.vtkMatrix4x4.Invert(planeToWorld, worldToPlane)

for pointIndex in range(pointListNode.GetNumberOfControlPoints()):
    # Get point position in world coordinate system
    point_World = [*pointListNode.GetNthControlPointPositionWorld(pointIndex), 1.0]
    # Get point position in the plane coordinate system
    point_Plane = worldToPlane.MultiplyPoint(point_World)
    # Third axis in the plane coordinate system is the plane normal direction, therefore the third coordinate
    # value is the distance from the plane
    distanceFromPlane = abs(point_Plane[2])
    print(f"Distance of point {pointListNode.GetNthControlPointLabel(pointIndex)} from plane: {distanceFromPlane:.2f}")
Measure distances of points from a line
Draw a markups line (L) and drop markups point list (F) in a view and then run the following code snippet to compute distances of the points from the line.
pointListNode = getNode("F")
lineNode = getNode("L")

# Get point list control point positions and line endpoints as numpy arrays
points = slicer.util.arrayFromMarkupsControlPoints(pointListNode)
line = slicer.util.arrayFromMarkupsControlPoints(lineNode)
# Compute distance of control points from the line
from numpy import cross
from numpy.linalg import norm
for i, point in enumerate(points):
    d = norm(cross(line[1]-line[0],point-line[0])/norm(line[1]-line[0]))
    print(f"Point {i}: Position = {point}. Distance from line = {d}.")
Set slice position and orientation from 3 markups control points
Drop 3 markups control points in the scene and copy-paste the code below into the Python console. After this, as you move the control points you’ll see the red slice view position and orientation will be set to make it fit to the 3 points.
# Update plane from control points
def UpdateSlicePlane(param1=None, param2=None):
  # Get control point positions as numpy array
  import numpy as np
  nOfControlPoints = pointListNode.GetNumberOfControlPoints()
  if nOfControlPoints < 3:
    return  # not enough control points
  points = np.zeros([3,nOfControlPoints])
  for i in range(0, nOfControlPoints):
    pointListNode.GetNthControlPointPosition(i, points[:,i])
  # Compute plane position and normal
  planePosition = points.mean(axis=1)
  planeNormal = np.cross(points[:,1] - points[:,0], points[:,2] - points[:,0])
  planeX = points[:,1] - points[:,0]
  sliceNode.SetSliceToRASByNTP(planeNormal[0], planeNormal[1], planeNormal[2],
    planeX[0], planeX[1], planeX[2],
    planePosition[0], planePosition[1], planePosition[2], 0)

# Get point list node from scene
sliceNode = slicer.app.layoutManager().sliceWidget("Red").mrmlSliceNode()
pointListNode = slicer.util.getNode("F")

# Update slice plane manually
UpdateSlicePlane()

# Update slice plane automatically whenever points are changed
pointListObservation = [pointListNode, pointListNode.AddObserver(slicer.vtkMRMLMarkupsNode.PointModifiedEvent, UpdateSlicePlane, 2)]
To stop automatic updates, run this:
pointListObservation[0].RemoveObserver(pointListObservation[1])
Switching to markups control point placement mode
To activate control point placement mode for a point list, both interaction mode has to be set and a point list node has to be selected:
interactionNode = slicer.app.applicationLogic().GetInteractionNode()
selectionNode = slicer.app.applicationLogic().GetSelectionNode()
selectionNode.SetReferenceActivePlaceNodeClassName("vtkMRMLMarkupsFiducialNode")
pointListNode = slicer.mrmlScene.AddNewNodeByClass("vtkMRMLMarkupsFiducialNode")
selectionNode.SetActivePlaceNodeID(pointListNode.GetID())
interactionNode.SetCurrentInteractionMode(interactionNode.Place)
Alternatively, qSlicerMarkupsPlaceWidget widget can be used to initiate markup placement:
# Temporary markups point list node
pointListNode = slicer.mrmlScene.AddNewNodeByClass("vtkMRMLMarkupsFiducialNode")

def placementModeChanged(active):
  print("Placement: " +("active" if active else "inactive"))
  # You can inspect what is in the markups node here, delete the temporary markup point list node, etc.

# Create and set up widget that contains a single "place control point" button. The widget can be placed in the module GUI.
placeWidget = slicer.qSlicerMarkupsPlaceWidget()
placeWidget.setMRMLScene(slicer.mrmlScene)
placeWidget.setCurrentNode(pointListNode)
placeWidget.buttonsVisible=False
placeWidget.placeButton().show()
placeWidget.connect("activeMarkupsFiducialPlaceModeChanged(bool)", placementModeChanged)
placeWidget.show()
Change markup point list display properties
Display properties are stored in display node(s) associated with the point list node.
pointListNode = getNode("F")
pointListDisplayNode = pointListNode.GetDisplayNode()
pointListDisplayNode.SetVisibility(False) # Hide all points
pointListDisplayNode.SetVisibility(True) # Show all points
pointListDisplayNode.SetSelectedColor(1,1,0) # Set color to yellow
pointListDisplayNode.SetViewNodeIDs(["vtkMRMLSliceNodeRed", "vtkMRMLViewNode1"]) # Only show in red slice view and first 3D view
Get a notification if a markup control point position is modified
Event management of Slicer-4.11 version is still subject to change. The example below shows how control point manipulation can be observed now.
def onMarkupChanged(caller,event):
  markupsNode = caller
  sliceView = markupsNode.GetAttribute(slicer.vtkMRMLMarkupsDisplayNode.GetMovingInSliceViewAttributeName())
  movingMarkupIndex = markupsNode.GetDisplayNode().GetActiveControlPoint()
  if movingMarkupIndex >= 0:
    pos = [0,0,0]
    markupsNode.GetNthControlPointPosition(movingMarkupIndex, pos)
    isPreview = markupsNode.GetNthControlPointPositionStatus(movingMarkupIndex) == slicer.vtkMRMLMarkupsNode.PositionPreview
    if isPreview:
      logging.info("Point {0} is previewed at {1} in slice view {2}".format(movingMarkupIndex, pos, sliceView))
    else:
      logging.info("Point {0} was moved {1} in slice view {2}".format(movingMarkupIndex, pos, sliceView))
  else:
    logging.info("Points modified: slice view = {0}".format(sliceView))

def onMarkupStartInteraction(caller, event):
  markupsNode = caller
  sliceView = markupsNode.GetAttribute(slicer.vtkMRMLMarkupsDisplayNode.GetMovingInSliceViewAttributeName())
  movingMarkupIndex = markupsNode.GetDisplayNode().GetActiveControlPoint()
  logging.info("Start interaction: point ID = {0}, slice view = {1}".format(movingMarkupIndex, sliceView))

def onMarkupEndInteraction(caller, event):
  markupsNode = caller
  sliceView = markupsNode.GetAttribute(slicer.vtkMRMLMarkupsDisplayNode.GetMovingInSliceViewAttributeName())
  movingMarkupIndex = markupsNode.GetDisplayNode().GetActiveControlPoint()
  logging.info("End interaction: point ID = {0}, slice view = {1}".format(movingMarkupIndex, sliceView))

pointListNode = slicer.mrmlScene.AddNewNodeByClass("vtkMRMLMarkupsFiducialNode")
pointListNode.AddControlPoint([0,0,0])
pointListNode.AddObserver(slicer.vtkMRMLMarkupsNode.PointModifiedEvent, onMarkupChanged)
pointListNode.AddObserver(slicer.vtkMRMLMarkupsNode.PointStartInteractionEvent, onMarkupStartInteraction)
pointListNode.AddObserver(slicer.vtkMRMLMarkupsNode.PointEndInteractionEvent, onMarkupEndInteraction)
Write markup control point positions to JSON file
pointListNode = getNode("F")
outputFileName = "c:/tmp/test.json"

# Get markup positions
data = []
for fidIndex in range(pointListNode.GetNumberOfControlPoints()):
  coords=[0,0,0]
  pointListNode.GetNthControlPointPosition(fidIndex,coords)
  data.append({"label": pointListNode.GetNthControlPointLabel(), "position": coords})

import json
with open(outputFileName, "w") as outfile:
  json.dump(data, outfile)
Write markup ROI to JSON file
roiNode = getNode("R")
outputFileName = "c:/tmp/test.json"

# Get ROI data
center = [0,0,0]
size = [0,0,0]
roiNode.GetCenterWorld(center)
roiNode.GetSizeWorld(size)
data = {"center": center, "size": size}

# Write to json file
import json
with open(outputFileName, "w") as outfile:
  json.dump(data, outfile)
Create markup plane JSON file - outside Slicer
This code can be used in any Python environment to create a markup json file containing a simple plane.
If you specify a plane by a single point ("planeType": "pointNormal") then you only need to specify:
plane position: position of the one and only control pointplane orientation:baseToNodematrix. Note that a plane in mathematical sense is specified by a position and a normal, but if you want to display a plane then you need to specify its rotation around that normal.baseToNodecontains the two axis of the plane and the plane normal. If you don’t care about the rotation then you can choose an arbitrary orientation and use cross product with the normal vector to make it orthogonal to the normal vector. Translation component of baseToNode matrix is ignored (because position is set by the control point), so it can be set to0.0, 0.0, 0.0.plane bounds: specifies how far the plane extends in 4 directions (-x, +x, -y, +y) from the plane position
outputFileName = "path/to/MyPlane.mrk.json"
center = [3.6764886856933536, -52.2593679682938, 41.715845278879044]
normal = [-0.9552783445937983, 0.2957081066696218, 0.0]
plane_bounds = [-50.0, 50.0, -50.0, 50.0]

import numpy as np
import json

normal /= np.linalg.norm(normal)

# Choose an arbitrary vector direction (x) that is not parallel to the normal
axis1 = np.array([1, 0, 0])
if np.linalg.norm(np.cross(normal, axis1)) < 0.1:
  # Almost parallel to the x axis, use another direction (y)
  axis1 = np.array([0, 1, 0])

# Calculate a third axis of the plane coordinate system (orthogonal to the other two)
axis2 = np.cross(normal, axis1)
axis2 /= np.linalg.norm(axis2)

# Get axis1 that is orthogonal to axis2 and normal
axis1 = np.cross(axis2, normal)
axis1 /= np.linalg.norm(axis1)

# Construct the rotation-translation matrix baseToNode
base_to_node_matrix = np.eye(4)
base_to_node_matrix[0:3, 0] = axis1
base_to_node_matrix[0:3, 1] = axis2
base_to_node_matrix[0:3, 2] = normal

data = {
    "@schema": "https://raw.githubusercontent.com/slicer/slicer/master/Modules/Loadable/Markups/Resources/Schema/markups-schema-v1.0.3.json#",
    "markups": [
        {
            "type": "Plane",
            "coordinateSystem": "LPS",
            "coordinateUnits": "mm",
            "planeType": "pointNormal",
            "sizeMode": "auto",
            "baseToNode": list(base_to_node_matrix.reshape(16)),
            "planeBounds": plane_bounds,
            "controlPoints": [{ "id": "1", "position": center }]
        }
    ]
}

with open(outputFileName, "w") as outfile:
  json.dump(data, outfile)
Fit slice plane to markup control points
sliceNode = slicer.mrmlScene.GetNodeByID("vtkMRMLSliceNodeRed")
pointListNode = slicer.mrmlScene.GetFirstNodeByName("F")
# Get markup point positions as numpy arrays
import numpy as np
p1 = np.zeros(3)
p2 = np.zeros(3)
p3 = np.zeros(3)
pointListNode.GetNthControlPointPosition(0, p1)
pointListNode.GetNthControlPointPosition(1, p2)
pointListNode.GetNthControlPointPosition(2, p3)
# Get plane axis directions
n = np.cross(p2-p1, p2-p3) # plane normal direction
n = n/np.linalg.norm(n)
t = np.cross([0.0, 0.0, 1], n) # plane transverse direction
t = t/np.linalg.norm(t)
# Set slice plane orientation and position
sliceNode.SetSliceToRASByNTP(n[0], n[1], n[2], t[0], t[1], t[2], p1[0], p1[1], p1[2], 0)
Change color of a markups node
Markups have Color and SelectedColor properties. SelectedColor is used if all control points are in “selected” state, which is the default. So, in most cases SetSelectedColor method must be used to change markups node color.
Display list of control points in my module’s GUI
The qSlicerSimpleMarkupsWidget can be integrated into module widgets to display list of markups control points and initiate placement. An example of this use is in Gel Dosimetry module.
Pre-populate the scene with measurements
This code snippet creates a set of predefined line markups (named A, B, C, D) in the scene when the user hits Ctrl+N. How to use this:
Customize the code (replace A, B, C, D with your measurement names) and copy-paste the code into the Python console. This has to be done only once after Slicer is started. Add it to .slicerrc.py file so that it persists even if Slicer is restarted.
Load the data set that has to be measured
Hit Ctrl+N to create all the measurements
Go to Markups module to see the list of measurements
For each measurement: select it in the data tree, click on the place button on the toolbar then click in slice or 3D views
def createMeasurements():
  for nodeName in ['A', 'B', 'C', 'D']:
    lineNode = slicer.mrmlScene.AddNewNodeByClass("vtkMRMLMarkupsLineNode", nodeName)
    lineNode.CreateDefaultDisplayNodes()
    dn = lineNode.GetDisplayNode()
    # Use crosshair glyph to allow more accurate point placement
    dn.SetGlyphTypeFromString("CrossDot2D")
    # Hide measurement result while markup up
    lineNode.GetMeasurement('length').SetEnabled(False)

shortcut1 = qt.QShortcut(slicer.util.mainWindow())
shortcut1.setKey(qt.QKeySequence("Ctrl+n"))
shortcut1.connect( 'activated()', createMeasurements)
Copy all measurements in the scene to Excel
This code snippet creates a set of predefined line markups (named A, B, C, D) in the scene when the user hits Ctrl+N. How to use this:
Copy-paste the code into the Python console. This has to be done only once after Slicer is started. Add it to .slicerrc.py file so that it persists even if Slicer is restarted.
Load the data set that has to be measured and place line markups (you can use the “Pre-populate the scene with measurements” script above to help with this)
Hit Ctrl+M to copy all line measurents to the clipboard
Switch to Excel and hit Ctrl+V to paste the results there
Save the scene, just in case later you need to review your measurements
def copyLineMeasurementsToClipboard():
  measurements = []
  # Collect all line measurements from the scene
  lineNodes = getNodesByClass('vtkMRMLMarkupsLineNode')
  for lineNode in lineNodes:
    if lineNode.GetNumberOfDefinedControlPoints() < 2:
      # incomplete line, skip it
      continue
    # Get node filename that the length was measured on
    try:
      volumeNode = slicer.mrmlScene.GetNodeByID(lineNode.GetNthControlPointAssociatedNodeID(0))
      imagePath = volumeNode.GetStorageNode().GetFileName()
    except:
      imagePath = '(unknown)'
    # Get line node n
    measurementName = lineNode.GetName()
    # Get length measurement
    lineNode.GetMeasurement('length').SetEnabled(True)
    length = str(lineNode.GetMeasurement('length').GetValue())
    # Add fields to results
    measurements.append('\t'.join([imagePath, measurementName, length]))
  # Copy all measurements to clipboard (to be pasted into Excel)
  outputText = "\n".join(measurements) + "\n"
  slicer.app.clipboard().setText(outputText)
  slicer.util.delayDisplay(f"Copied {len(measurements)} length measurements to the clipboard.")

shortcut2 = qt.QShortcut(slicer.util.mainWindow())
shortcut2.setKey(qt.QKeySequence("Ctrl+m"))
shortcut2.connect( 'activated()', copyLineMeasurementsToClipboard)
To copy all measurement results to a file instead of copying it to the clipboard, replace slicer.app.clipboard... line by these lines:
with open("c:/tmp/results.csv", "a") as f:
  f.write(outputText)
Use markups json files in Python - outside Slicer
The examples below show how to use markups json files outside Slicer, in any Python environment.
To access content of a json file it can be either read as a json document or directly into a pandas dataframe using a single command.
Get a table of control point labels and positions
Get table from the first markups node in the file:
import pandas as pd
controlPointsTable = pd.DataFrame.from_dict(pd.read_json(input_json_filename)['markups'][0]['controlPoints'])
Result:
>>> controlPointsTable
  label                                        position
0   F-1  [-53.388409961685824, -73.33572796934868, 0.0]
1   F-2     [49.8682950191571, -88.58955938697324, 0.0]
2   F-3   [-25.22749042145594, 59.255268199233726, 0.0]
Access position of control points positions in separate x, y, z columns
controlPointsTable[['x','y','z']] = pd.DataFrame(controlPointsTable['position'].to_list())
del controlPointsTable['position']
Write control points to a csv file
controlPointsTable.to_csv(output_csv_filename)
Resulting csv file:
   ,label,x,y,z
   0,F-1,-53.388409961685824,-73.33572796934868,0.0
   1,F-2,49.8682950191571,-88.58955938697324,0.0
   2,F-3,-25.22749042145594,59.255268199233726,0.0
Assign custom actions to markups
Custom actions can be assigned to markups, which can be triggered by any interaction event (mouse or keyboard action). The actions can be detected by adding observers to the markup node’s display node.
# This example adds an action to the default double-click action on a markup
# and defines two new custom actions. It is done for all existing markups in the first 3D view.
#
# How to use:
# 1. Create markups nodes.
# 2. Run the script below.
# 3. Double-click on the markup -> this triggers toggleLabelVisibilty.
# 4. Hover the mouse over a markup then pressing `q` and `w` keys -> this triggers shrinkControlPoints and growControlPoints.

threeDViewNode = slicer.mrmlScene.GetNodeByID("vtkMRMLViewNode1")
appLogic = slicer.app.applicationLogic()
markupsDisplayableManager = appLogic.GetViewDisplayableManagerByClassName(threeDViewNode, "vtkMRMLMarkupsDisplayableManager")

def shrinkControlPoints(caller, eventId):
  markupsDisplayNode = caller
  markupsDisplayNode.SetGlyphScale(markupsDisplayNode.GetGlyphScale()/1.1)

def growControlPoints(caller, eventId):
  markupsDisplayNode = caller
  markupsDisplayNode.SetGlyphScale(markupsDisplayNode.GetGlyphScale()*1.1)

def toggleLabelVisibility(caller, eventId):
  markupsDisplayNode = caller
  markupsDisplayNode.SetPointLabelsVisibility(not markupsDisplayNode.GetPointLabelsVisibility())

observations = []  # store the observations so that later can be removed
markupsDisplayNodes = slicer.util.getNodesByClass("vtkMRMLMarkupsDisplayNode")
for markupsDisplayNode in markupsDisplayNodes:
  # Assign keyboard shortcut to trigger custom actions
  markupsWidget = markupsDisplayableManager.GetWidget(markupsDisplayNode)
  # Left double-click interaction event is translated to markupsWidget.WidgetEventAction by default,
  # therefore we don't need to add an event translation for that. We just add two keyboard event translation for two custom actions
  markupsWidget.SetKeyboardEventTranslation(markupsWidget.WidgetStateOnWidget, vtk.vtkEvent.NoModifier, '\0', 0, "q", markupsWidget.WidgetEventCustomAction1)
  markupsWidget.SetKeyboardEventTranslation(markupsWidget.WidgetStateOnWidget, vtk.vtkEvent.NoModifier, '\0', 0, "w", markupsWidget.WidgetEventCustomAction2)
  # Add observer to custom actions
  observations.append([markupsDisplayNode, markupsDisplayNode.AddObserver(markupsDisplayNode.ActionEvent, toggleLabelVisibility)])
  observations.append([markupsDisplayNode, markupsDisplayNode.AddObserver(markupsDisplayNode.CustomActionEvent1, shrinkControlPoints)])
  observations.append([markupsDisplayNode, markupsDisplayNode.AddObserver(markupsDisplayNode.CustomActionEvent2, growControlPoints)])

# Remove observations when custom actions are not needed anymore by uncommenting these lines:
for observedNode, observation in observations:
  observedNode.RemoveObserver(observation)
Models
Show a simple surface mesh as a model node
This example shows how to display a simple surface mesh (a box, created by a VTK source filter) as a model node.
# Create and set up polydata source
box = vtk.vtkCubeSource()
box.SetXLength(30)
box.SetYLength(20)
box.SetZLength(15)
box.SetCenter(10,20,5)

# Create a model node that displays output of the source
boxNode = slicer.modules.models.logic().AddModel(box.GetOutputPort())

# Adjust display properties
boxNode.GetDisplayNode().SetColor(1,0,0)
boxNode.GetDisplayNode().SetOpacity(0.8)
Measure distance of points from surface
This example computes closest distance of points (markups point list F) from a surface (model node mymodel) and writes results into a table.
pointListNode = getNode("F")
modelNode = getNode("mymodel")

# Transform model polydata to world coordinate system
if modelNode.GetParentTransformNode():
  transformModelToWorld = vtk.vtkGeneralTransform()
  slicer.vtkMRMLTransformNode.GetTransformBetweenNodes(modelNode.GetParentTransformNode(), None, transformModelToWorld)
  polyTransformToWorld = vtk.vtkTransformPolyDataFilter()
  polyTransformToWorld.SetTransform(transformModelToWorld)
  polyTransformToWorld.SetInputData(modelNode.GetPolyData())
  polyTransformToWorld.Update()
  surface_World = polyTransformToWorld.GetOutput()
else:
  surface_World = modelNode.GetPolyData()

# Create arrays to store results
indexCol = vtk.vtkIntArray()
indexCol.SetName("Index")
labelCol = vtk.vtkStringArray()
labelCol.SetName("Name")
distanceCol = vtk.vtkDoubleArray()
distanceCol.SetName("Distance")

distanceFilter = vtk.vtkImplicitPolyDataDistance()
distanceFilter.SetInput(surface_World)
nOfControlPoints = pointListNode.GetNumberOfControlPoints()
for i in range(0, nOfControlPoints):
  point_World = [0,0,0]
  pointListNode.GetNthControlPointPositionWorld(i, point_World)
  closestPointOnSurface_World = [0,0,0]
  closestPointDistance = distanceFilter.EvaluateFunctionAndGetClosestPoint(point_World, closestPointOnSurface_World)
  indexCol.InsertNextValue(i)
  labelCol.InsertNextValue(pointListNode.GetNthControlPointLabel(i))
  distanceCol.InsertNextValue(closestPointDistance)

# Create a table from result arrays
resultTableNode = slicer.mrmlScene.AddNewNodeByClass("vtkMRMLTableNode", "Points from surface distance")
resultTableNode.AddColumn(indexCol)
resultTableNode.AddColumn(labelCol)
resultTableNode.AddColumn(distanceCol)

# Show table in view layout
slicer.app.layoutManager().setLayout(slicer.vtkMRMLLayoutNode.SlicerLayoutFourUpTableView)
slicer.app.applicationLogic().GetSelectionNode().SetReferenceActiveTableID(resultTableNode.GetID())
slicer.app.applicationLogic().PropagateTableSelection()
Add a texture mapped plane to the scene as a model
# Create model node
planeSource = vtk.vtkPlaneSource()
planeSource.SetOrigin(-50.0, -50.0, 0.0)
planeSource.SetPoint1(50.0, -50.0, 0.0)
planeSource.SetPoint2(-50.0, 50.0, 0.0)
model = slicer.modules.models.logic().AddModel(planeSource.GetOutputPort())

# Tune display properties
modelDisplay = model.GetDisplayNode()
modelDisplay.SetColor(1,1,0) # yellow
modelDisplay.SetBackfaceCulling(0)

# Add texture (just use image of an ellipsoid)
e = vtk.vtkImageEllipsoidSource()
modelDisplay.SetTextureImageDataConnection(e.GetOutputPort())
Note
Model textures are not exposed in the GUI and are not saved in the scene.
Get scalar values at surface of a model
The following script allows getting selected scalar value at a selected position of a model. Position can be selected by moving the mouse while holding down Shift key.
modelNode = getNode("sphere")
modelPointValues = modelNode.GetPolyData().GetPointData().GetArray("Normals")
pointListNode = slicer.mrmlScene.GetFirstNodeByName("F")

if not pointListNode:
  pointListNode = slicer.mrmlScene.AddNewNodeByClass("vtkMRMLMarkupsFiducialNode","F")

pointsLocator = vtk.vtkPointLocator() # could try using vtk.vtkStaticPointLocator() if need to optimize
pointsLocator.SetDataSet(modelNode.GetPolyData())
pointsLocator.BuildLocator()

def onMouseMoved(observer,eventid):
  ras=[0,0,0]
  crosshairNode.GetCursorPositionRAS(ras)
  closestPointId = pointsLocator.FindClosestPoint(ras)
  ras = modelNode.GetPolyData().GetPoint(closestPointId)
  closestPointValue = modelPointValues.GetTuple(closestPointId)
  if pointListNode.GetNumberOfControlPoints() == 0:
    pointListNode.AddControlPoint(ras)
  else:
    pointListNode.SetNthControlPointPosition(0,*ras)
  print(f"RAS={ras}  value={closestPointValue}")

crosshairNode=slicer.util.getNode("Crosshair")
observationId = crosshairNode.AddObserver(slicer.vtkMRMLCrosshairNode.CursorPositionModifiedEvent, onMouseMoved)

# To stop printing of values run this:
# crosshairNode.RemoveObserver(observationId)
Apply VTK filter on a model node
modelNode = getNode("tip")

# Compute curvature
curv = vtk.vtkCurvatures()
curv.SetInputData(modelNode.GetPolyData())
modelNode.SetPolyDataConnection(curv.GetOutputPort())

# Set up coloring by Curvature
modelNode.GetDisplayNode().SetActiveScalar("Gauss_Curvature", vtk.vtkAssignAttribute.POINT_DATA)
modelNode.GetDisplayNode().SetAndObserveColorNodeID("Viridis")
modelNode.GetDisplayNode().SetScalarVisibility(True)
Select cells of a model using markups point list
The following script selects cells of a model node that are closest to positions of markups control points.
# Get input nodes
modelNode = slicer.util.getNode("Segment_1") # select cells in this model
pointListNode = slicer.util.getNode("F") # points will be selected at positions specified by this markups point list node

# Create scalar array that will store selection state
cellScalars = modelNode.GetMesh().GetCellData()
selectionArray = cellScalars.GetArray("selection")
if not selectionArray:
  selectionArray = vtk.vtkIntArray()
  selectionArray.SetName("selection")
  selectionArray.SetNumberOfValues(modelNode.GetMesh().GetNumberOfCells())
  selectionArray.Fill(0)
  cellScalars.AddArray(selectionArray)

# Set up coloring by selection array
modelNode.GetDisplayNode().SetActiveScalar("selection", vtk.vtkAssignAttribute.CELL_DATA)
modelNode.GetDisplayNode().SetAndObserveColorNodeID("vtkMRMLColorTableNodeWarm1")
modelNode.GetDisplayNode().SetScalarVisibility(True)

# Initialize cell locator
cell = vtk.vtkCellLocator()
cell.SetDataSet(modelNode.GetMesh())
cell.BuildLocator()

def onPointsModified(observer=None, eventid=None):
  global pointListNode, selectionArray
  selectionArray.Fill(0) # set all cells to non-selected by default
  markupPoints = slicer.util.arrayFromMarkupsControlPoints(pointListNode)
  closestPoint = [0.0, 0.0, 0.0]
  cellObj = vtk.vtkGenericCell()
  cellId = vtk.mutable(0)
  subId = vtk.mutable(0)
  dist2 = vtk.mutable(0.0)
  for markupPoint in markupPoints:
    cell.FindClosestPoint(markupPoint, closestPoint, cellObj, cellId, subId, dist2)
    closestCell = cellId.get()
    if closestCell >=0:
      selectionArray.SetValue(closestCell, 100) # set selected cell's scalar value to non-zero
  selectionArray.Modified()

# Initial update
onPointsModified()
# Automatic update each time when a markup point is modified
pointListNodeObserverTag = pointListNode.AddObserver(slicer.vtkMRMLMarkupsNode.PointModifiedEvent, onPointsModified)

# To stop updating selection, run this:
# pointListNode.RemoveObserver(pointListNodeObserverTag)
Export entire scene as glTF
glTF is a modern and very efficient file format for surface meshes, which is supported by many web viewers, such as:
https://3dviewer.net/ (requires a single zip file that contains all the exported files)
https://gltf-viewer.donmccurdy.com/ (the exported folder can be drag-and-dropped to the webpage)
SlicerOpenAnatomy extension provides rich export of models and segmentations (preserving names, hierarchy, etc.), but for a basic export operation this code snippet can be used:
exporter = vtk.vtkGLTFExporter()
exporter.SetRenderWindow(slicer.app.layoutManager().threeDWidget(0).threeDView().renderWindow())
exporter.SetFileName("c:/tmp/newfolder/mymodel.gltf")
exporter.Write()
Export entire scene as VRML
Save all surface meshes displayed in the scene (models, markups, etc). Solid colors and coloring by scalar is preserved. Textures are not supported. VRML is a very old general-purpose scene file format, which is still supported by some software.
exporter = vtk.vtkVRMLExporter()
exporter.SetRenderWindow(slicer.app.layoutManager().threeDWidget(0).threeDView().renderWindow())
exporter.SetFileName("C:/tmp/something.wrl")
exporter.Write()
Export model to Blender, including color by scalar
   modelNode = getNode("Model")
   plyFilePath = "c:/tmp/model.ply"

   modelDisplayNode = modelNode.GetDisplayNode()
   triangles = vtk.vtkTriangleFilter()
   triangles.SetInputConnection(modelDisplayNode.GetOutputPolyDataConnection())

   plyWriter = vtk.vtkPLYWriter()
   plyWriter.SetInputConnection(triangles.GetOutputPort())
   lut = vtk.vtkLookupTable()
   lut.DeepCopy(modelDisplayNode.GetColorNode().GetLookupTable())
   lut.SetRange(modelDisplayNode.GetScalarRange())
   plyWriter.SetLookupTable(lut)
   plyWriter.SetArrayName(modelDisplayNode.GetActiveScalarName())

   plyWriter.SetFileName(plyFilePath)
   plyWriter.Write()
Show comparison view of all model files a folder
# Inputs
modelDir = "c:/some/folder/containing/models"
modelFileExt = "stl"
numberOfColumns = 4

import math
import os
modelFiles = list(f for f in os.listdir(modelDir) if f.endswith("." + modelFileExt))

# Create a custom layout
numberOfRows = int(math.ceil(len(modelFiles)/numberOfColumns))
customLayoutId=567  # we pick a random id that is not used by others
slicer.app.setRenderPaused(True)
customLayout = '<layout type="vertical">'
viewIndex = 0
for rowIndex in range(numberOfRows):
  customLayout += '<item><layout type="horizontal">'
  for colIndex in range(numberOfColumns):
    name = os.path.basename(modelFiles[viewIndex]) if viewIndex < len(modelFiles) else "compare " + str(viewIndex)
    customLayout += '<item><view class="vtkMRMLViewNode" singletontag="'+name
    customLayout += '"><property name="viewlabel" action="default">'+name+'</property></view></item>'
    viewIndex += 1
  customLayout += '</layout></item>'

customLayout += '</layout>'
if not slicer.app.layoutManager().layoutLogic().GetLayoutNode().SetLayoutDescription(customLayoutId, customLayout):
    slicer.app.layoutManager().layoutLogic().GetLayoutNode().AddLayoutDescription(customLayoutId, customLayout)

slicer.app.layoutManager().setLayout(customLayoutId)

# Load and show each model in a view
for modelIndex, modelFile in enumerate(modelFiles):
  # Show only one model in each view
  name = os.path.basename(modelFile)
  viewNode = slicer.mrmlScene.GetSingletonNode(name, "vtkMRMLViewNode")
  viewNode.LinkedControlOn()
  modelNode = slicer.util.loadModel(modelDir + "/" + modelFile)
  modelNode.GetDisplayNode().AddViewNodeID(viewNode.GetID())

slicer.app.setRenderPaused(False)
Rasterize a model and save it to a series of image files
This example shows how to generate a stack of image files from an STL file:
inputModelFile = "/some/input/folder/SomeShape.stl"
outputDir = "/some/output/folder"
outputVolumeLabelValue = 100
outputVolumeSpacingMm = [0.5, 0.5, 0.5]
outputVolumeMarginMm = [10.0, 10.0, 10.0]

# Read model
inputModel = slicer.util.loadModel(inputModelFile)

# Determine output volume geometry and create a corresponding reference volume
import math
import numpy as np
bounds = np.zeros(6)
inputModel.GetBounds(bounds)
imageData = vtk.vtkImageData()
imageSize = [ int((bounds[axis*2+1]-bounds[axis*2]+outputVolumeMarginMm[axis]*2.0)/outputVolumeSpacingMm[axis]) for axis in range(3) ]
imageOrigin = [ bounds[axis*2]-outputVolumeMarginMm[axis] for axis in range(3) ]
imageData.SetDimensions(imageSize)
imageData.AllocateScalars(vtk.VTK_UNSIGNED_CHAR, 1)
imageData.GetPointData().GetScalars().Fill(0)
referenceVolumeNode = slicer.mrmlScene.AddNewNodeByClass("vtkMRMLScalarVolumeNode")
referenceVolumeNode.SetOrigin(imageOrigin)
referenceVolumeNode.SetSpacing(outputVolumeSpacingMm)
referenceVolumeNode.SetAndObserveImageData(imageData)
referenceVolumeNode.CreateDefaultDisplayNodes()

# Convert model to labelmap
seg = slicer.mrmlScene.AddNewNodeByClass("vtkMRMLSegmentationNode")
seg.SetReferenceImageGeometryParameterFromVolumeNode(referenceVolumeNode)
slicer.modules.segmentations.logic().ImportModelToSegmentationNode(inputModel, seg)
seg.CreateBinaryLabelmapRepresentation()
outputLabelmapVolumeNode = slicer.mrmlScene.AddNewNodeByClass("vtkMRMLLabelMapVolumeNode")
slicer.modules.segmentations.logic().ExportVisibleSegmentsToLabelmapNode(seg, outputLabelmapVolumeNode, referenceVolumeNode)
outputLabelmapVolumeArray = (slicer.util.arrayFromVolume(outputLabelmapVolumeNode) * outputVolumeLabelValue).astype("int8")

# Install dependencies
try:
  import imageio
except ModuleNotFoundError:
  slicer.packaging.pip_install("imageio")
  import imageio

# Write labelmap volume to series of TIFF files
for i in range(len(outputLabelmapVolumeArray)):
  imageio.imwrite(f"{outputDir}/image_{i:03}.tiff", outputLabelmapVolumeArray[i])
Tip
To learn how to use slicer.packaging.pip_install() within a Slicer module, refer to the Install a Python package example in the Script Repository.
Plots
Slicer plots displayed in view layout
Create histogram plot of a volume and show it embedded in the view layout. More information: https://www.slicer.org/wiki/Documentation/Nightly/Developers/Plots
Using slicer.util.plot() utility function
# Get a volume from SampleData and compute its histogram
import SampleData
import numpy as np
volumeNode = SampleData.SampleDataLogic().downloadMRHead()
histogram = np.histogram(slicer.util.arrayFromVolume(volumeNode), bins=50)

chartNode = slicer.util.plot(histogram, xColumnIndex = 1)
chartNode.SetYAxisRangeAuto(False)
chartNode.SetYAxisRange(0, 4e5)
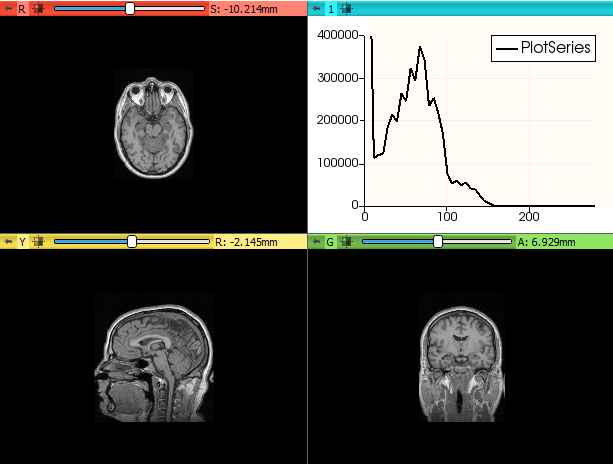
Using MRML classes only
# Get a volume from SampleData
import SampleData
volumeNode = SampleData.SampleDataLogic().downloadMRHead()

# Compute histogram values
import numpy as np
histogram = np.histogram(slicer.util.arrayFromVolume(volumeNode), bins=50)

# Save results to a new table node
tableNode=slicer.mrmlScene.AddNewNodeByClass("vtkMRMLTableNode")
slicer.util.updateTableFromArray(tableNode, histogram)
tableNode.GetTable().GetColumn(0).SetName("Count")
tableNode.GetTable().GetColumn(1).SetName("Intensity")

# Create plot
plotSeriesNode = slicer.mrmlScene.AddNewNodeByClass("vtkMRMLPlotSeriesNode", volumeNode.GetName() + " histogram")
plotSeriesNode.SetAndObserveTableNodeID(tableNode.GetID())
plotSeriesNode.SetXColumnName("Intensity")
plotSeriesNode.SetYColumnName("Count")
plotSeriesNode.SetPlotType(plotSeriesNode.PlotTypeScatterBar)
plotSeriesNode.SetColor(0, 0.6, 1.0)

# Create chart and add plot
plotChartNode = slicer.mrmlScene.AddNewNodeByClass("vtkMRMLPlotChartNode")
plotChartNode.AddAndObservePlotSeriesNodeID(plotSeriesNode.GetID())
plotChartNode.YAxisRangeAutoOff()
plotChartNode.SetYAxisRange(0, 500000)

# Show plot in layout
slicer.modules.plots.logic().ShowChartInLayout(plotChartNode)
Save a plot as vector graphics (.svg)
plotView = slicer.app.layoutManager().plotWidget(0).plotView()
plotView.saveAsSVG("c:/tmp/test.svg")
Using matplotlib
Matplotlib may be used from within Slicer, but the default Tk backend locks up and crashes Slicer. However, Matplotlib may still be used through other backends. More details can be found on the MatPlotLib pages.
Non-interactive plot
try:
  import matplotlib
except ModuleNotFoundError:
  slicer.packaging.pip_install("matplotlib")
  import matplotlib

matplotlib.use("Agg")
from pylab import *

t1 = arange(0.0, 5.0, 0.1)
t2 = arange(0.0, 5.0, 0.02)
t3 = arange(0.0, 2.0, 0.01)

subplot(211)
plot(t1, cos(2*pi*t1)*exp(-t1), "bo", t2, cos(2*pi*t2)*exp(-t2), "k")
grid(True)
title("A tale of 2 subplots")
ylabel("Damped")

subplot(212)
plot(t3, cos(2*pi*t3), "r--")
grid(True)
xlabel("time (s)")
ylabel("Undamped")
savefig("MatplotlibExample.png")

# Static image view
pm = qt.QPixmap("MatplotlibExample.png")
imageWidget = qt.QLabel()
imageWidget.setPixmap(pm)
imageWidget.setScaledContents(True)
imageWidget.show()
Tip
To learn how to use slicer.packaging.pip_install() within a Slicer module, refer to the Install a Python package example in the Script Repository.
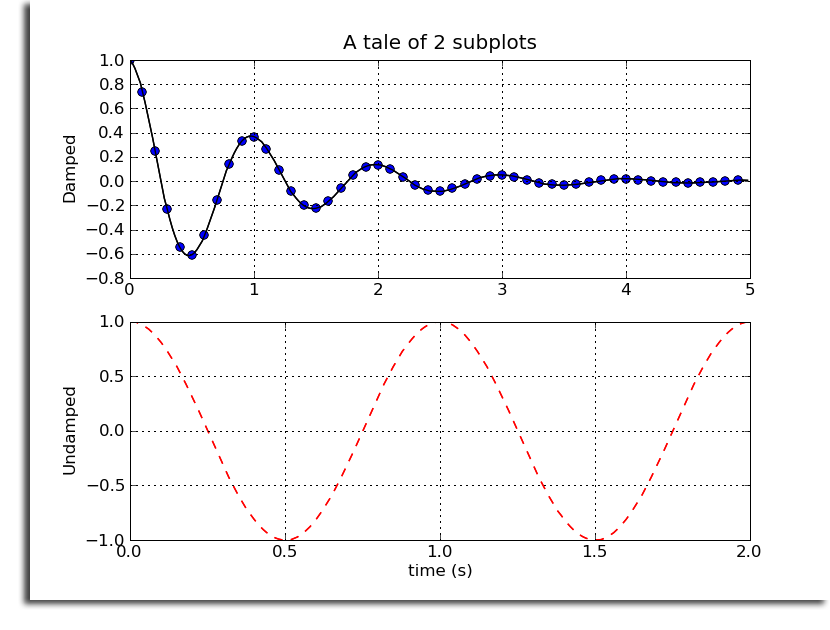
Plot in Slicer Jupyter notebook
import JupyterNotebooksLib as slicernb
try:
  import matplotlib
except ModuleNotFoundError:
  slicer.packaging.pip_install("matplotlib")
  import matplotlib

matplotlib.use("Agg")

import matplotlib.pyplot as plt
import numpy as np

def f(t):
  s1 = np.cos(2*np.pi*t)
  e1 = np.exp(-t)
  return s1 * e1

t1 = np.arange(0.0, 5.0, 0.1)
t2 = np.arange(0.0, 5.0, 0.02)
t3 = np.arange(0.0, 2.0, 0.01)


fig, axs = plt.subplots(2, 1, constrained_layout=True)
axs[0].plot(t1, f(t1), "o", t2, f(t2), "-")
axs[0].set_title("subplot 1")
axs[0].set_xlabel("distance (m)")
axs[0].set_ylabel("Damped oscillation")
fig.suptitle("This is a somewhat long figure title", fontsize=16)

axs[1].plot(t3, np.cos(2*np.pi*t3), "--")
axs[1].set_xlabel("time (s)")
axs[1].set_title("subplot 2")
axs[1].set_ylabel("Undamped")

slicernb.MatplotlibDisplay(matplotlib.pyplot)
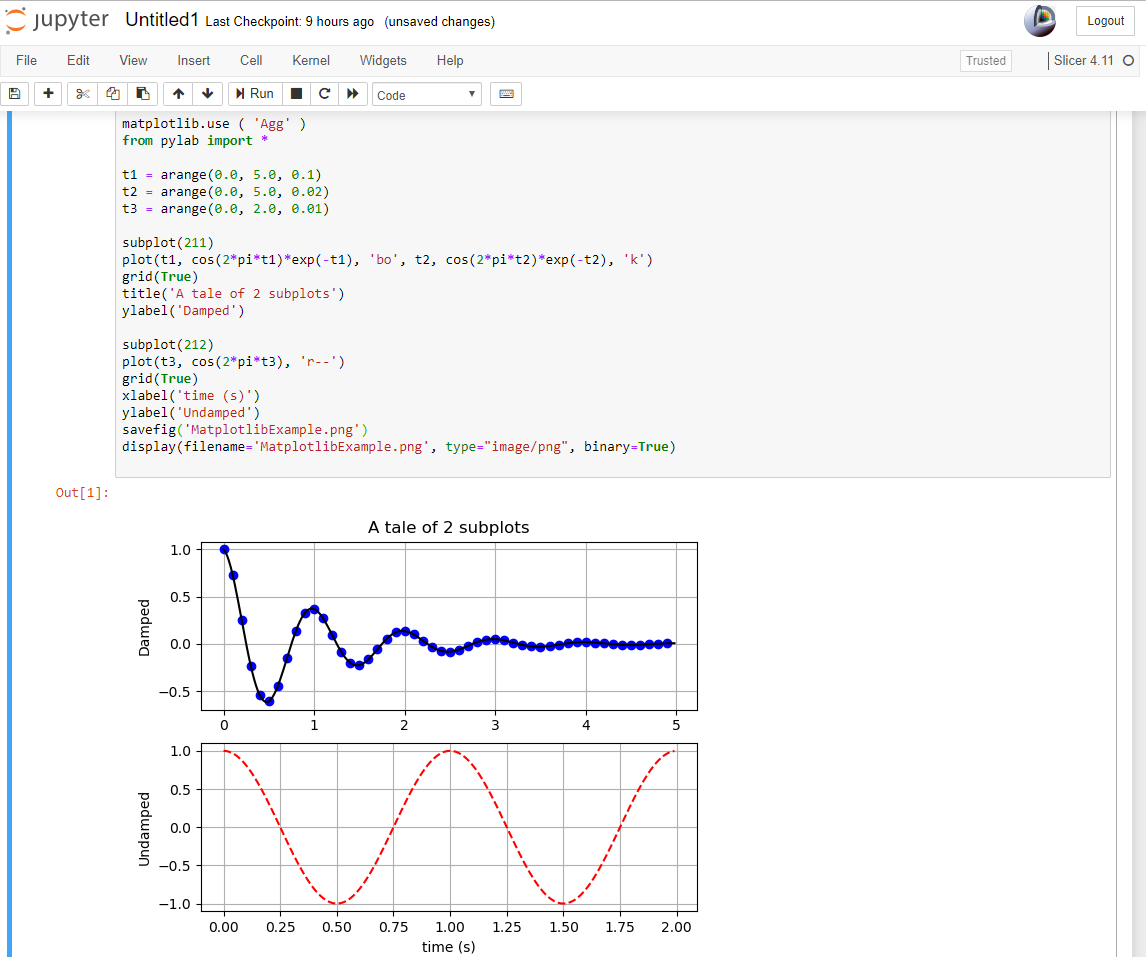
Interactive plot using wxWidgets GUI toolkit
try:
  import matplotlib
  import wx
except ModuleNotFoundError:
  slicer.packaging.pip_install("matplotlib wxPython")
  import matplotlib

# Get a volume from SampleData and compute its histogram
import SampleData
import numpy as np
volumeNode = SampleData.SampleDataLogic().downloadMRHead()
histogram = np.histogram(slicer.util.arrayFromVolume(volumeNode), bins=50)

# Set matplotlib to use WXAgg backend
import matplotlib
matplotlib.use("WXAgg")

# Show an interactive plot
import matplotlib.pyplot as plt
fig, ax = plt.subplots()
ax.plot(histogram[1][1:], histogram[0].astype(float))
ax.grid(True)
ax.set_ylim((0, 4e5))
plt.show(block=False)
Tip
To learn how to use slicer.packaging.pip_install() within a Slicer module, refer to the Install a Python package example in the Script Repository.
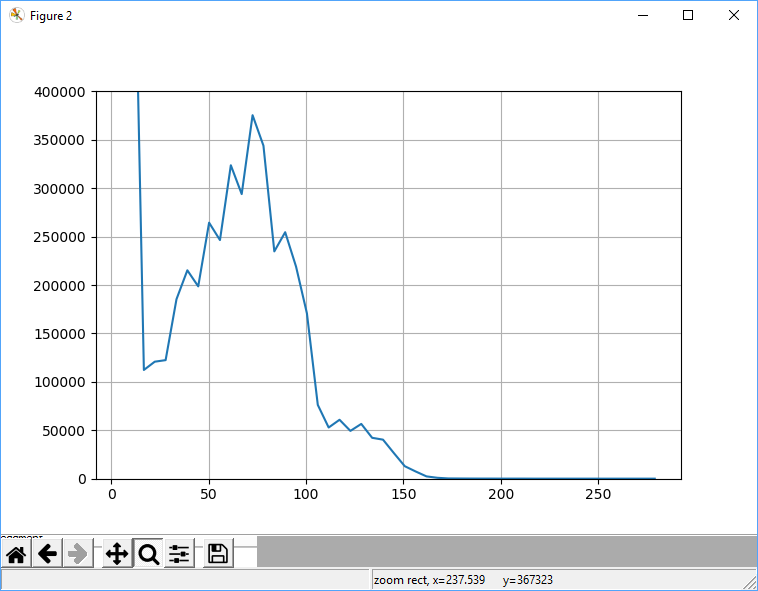
Screen Capture
Capture the full Slicer screen and save it into a file
img = qt.QPixmap.grabWidget(slicer.util.mainWindow()).toImage()
img.save("c:/tmp/test.png")
Capture all the views save it into a file
import ScreenCapture
cap = ScreenCapture.ScreenCaptureLogic()
cap.showViewControllers(False)
cap.captureImageFromView(None, "c:/tmp/test.png")
cap.showViewControllers(True)
Capture a single view
viewNodeID = "vtkMRMLViewNode1"
import ScreenCapture
cap = ScreenCapture.ScreenCaptureLogic()
view = cap.viewFromNode(slicer.mrmlScene.GetNodeByID(viewNodeID))
cap.captureImageFromView(view, "c:/tmp/test.png")
Common values for viewNodeID: vtkMRMLSliceNodeRed, vtkMRMLSliceNodeYellow, vtkMRMLSliceNodeGreen, vtkMRMLViewNode1, vtkMRMLViewNode2. The ScreenCapture module can also create video animations of rotating views, slice sweeps, etc.
Capture a slice view sweep into a series of PNG files
For example, Red slice view, 30 images, from position -125.0 to 75.0, into c:/tmp folder, with name image_00001.png, image_00002.png, …
import ScreenCapture
ScreenCapture.ScreenCaptureLogic().captureSliceSweep(getNode("vtkMRMLSliceNodeRed"), -125.0, 75.0, 30, "c:/tmp", "image_%05d.png")
Capture 3D view into PNG file with transparent background
# Set background to black (required for transparent background)
view = slicer.app.layoutManager().threeDWidget(0).threeDView()
view.mrmlViewNode().SetBackgroundColor(0,0,0)
view.mrmlViewNode().SetBackgroundColor2(0,0,0)
view.forceRender()
# Capture RGBA image
renderWindow = view.renderWindow()
renderWindow.SetAlphaBitPlanes(1)
wti = vtk.vtkWindowToImageFilter()
wti.SetInputBufferTypeToRGBA()
wti.SetInput(renderWindow)
writer = vtk.vtkPNGWriter()
writer.SetFileName("c:/tmp/screenshot.png")
writer.SetInputConnection(wti.GetOutputPort())
writer.Write()
Capture slice view into PNG file with white background
sliceViewName = "Red"
filename = "c:/tmp/screenshot.png"

# Set view background to white
view = slicer.app.layoutManager().sliceWidget(sliceViewName).sliceView()
view.setBackgroundColor(qt.QColor.fromRgbF(1,1,1))
view.forceRender()

# Capture a screenshot
import ScreenCapture
cap = ScreenCapture.ScreenCaptureLogic()
cap.captureImageFromView(view, filename)
Save a series of images from a slice view
You can use ScreenCapture module to capture series of images. To do it programmatically, save the following into a file such as /tmp/record.py and then in the Slicer python console type execfile("/tmp/record.py")
layoutName = "Green"
imagePathPattern = "/tmp/image-%03d.png"
steps = 10

widget = slicer.app.layoutManager().sliceWidget(layoutName)
view = widget.sliceView()
logic = widget.sliceLogic()
bounds = [0,]*6
logic.GetSliceBounds(bounds)

for step in range(steps):
  offset = bounds[4] + step/(1.*steps) * (bounds[5]-bounds[4])
  logic.SetSliceOffset(offset)
  view.forceRender()
  image = qt.QPixmap.grabWidget(view).toImage()
  image.save(imagePathPattern % step)
Segmentations
Load a 3D image or model file as segmentation
# Load segmentation from .seg.nrrd file (includes segment names and colors)
slicer.util.loadSegmentation("c:/tmp/tmp/Segmentation.nrrd")

# Create segmentation from a NIFTI + color table file
colorNode = slicer.util.loadColorTable('c:/tmp/tmp/Segmentation-label_ColorTable.ctbl')
slicer.util.loadSegmentation("c:/tmp/tmp/Segmentation.nii", {'colorNodeID': colorNode.GetID()})

# Create segmentation from a STL file
slicer.util.loadSegmentation("c:/tmp/Segment_1.stl")
Create a segmentation from a labelmap volume and display in 3D
labelmapVolumeNode = getNode("label")
seg = slicer.mrmlScene.AddNewNodeByClass("vtkMRMLSegmentationNode")
slicer.modules.segmentations.logic().ImportLabelmapToSegmentationNode(labelmapVolumeNode, seg)
seg.CreateClosedSurfaceRepresentation()
slicer.mrmlScene.RemoveNode(labelmapVolumeNode)
The last line is optional. It removes the original labelmap volume so that the same information is not shown twice.
Create segmentation from a model node
# Create some model that will be added to a segmentation node
sphere = vtk.vtkSphereSource()
sphere.SetCenter(-6, 30, 28)
sphere.SetRadius(10)
modelNode = slicer.modules.models.logic().AddModel(sphere.GetOutputPort())

# Create segmentation
segmentationNode = slicer.mrmlScene.AddNewNodeByClass("vtkMRMLSegmentationNode")
segmentationNode.CreateDefaultDisplayNodes() # only needed for display

# Import the model into the segmentation node
slicer.modules.segmentations.logic().ImportModelToSegmentationNode(modelNode, segmentationNode)
Export labelmap node from segmentation node
Export labelmap matching reference geometry of the segmentation:
segmentationNode = getNode("Segmentation")
labelmapVolumeNode = slicer.mrmlScene.AddNewNodeByClass("vtkMRMLLabelMapVolumeNode")
slicer.modules.segmentations.logic().ExportAllSegmentsToLabelmapNode(segmentationNode, labelmapVolumeNode, slicer.vtkSegmentation.EXTENT_REFERENCE_GEOMETRY)
Export smallest possible labelmap:
segmentationNode = getNode("Segmentation")
labelmapVolumeNode = slicer.mrmlScene.AddNewNodeByClass("vtkMRMLLabelMapVolumeNode")
slicer.modules.segmentations.logic().ExportAllSegmentsToLabelmapNode(segmentationNode, labelmapVolumeNode)
Export labelmap that matches geometry of a chosen reference volume:
segmentationNode = getNode("Segmentation")
labelmapVolumeNode = slicer.mrmlScene.AddNewNodeByClass("vtkMRMLLabelMapVolumeNode")
slicer.modules.segmentations.logic().ExportVisibleSegmentsToLabelmapNode(segmentationNode, labelmapVolumeNode, referenceVolumeNode)
Export a selection of segments (identified by their names):
segmentNames = ["Prostate", "Urethra"]
segmentIds = vtk.vtkStringArray()
for segmentName in segmentNames:
  segmentId = segmentationNode.GetSegmentation().GetSegmentIdBySegmentName(segmentName)
  segmentIds.InsertNextValue(segmentId)
slicer.vtkSlicerSegmentationsModuleLogic.ExportSegmentsToLabelmapNode(segmentationNode, segmentIds, labelmapVolumeNode, referenceVolumeNode)
Export to file by pressing Ctrl+Shift+S key:
outputPath = "c:/tmp"

def exportLabelmap():
  segmentationNode = slicer.mrmlScene.GetFirstNodeByClass("vtkMRMLSegmentationNode")
  referenceVolumeNode = slicer.mrmlScene.GetFirstNodeByClass("vtkMRMLScalarVolumeNode")
  labelmapVolumeNode = slicer.mrmlScene.AddNewNodeByClass("vtkMRMLLabelMapVolumeNode")
  slicer.modules.segmentations.logic().ExportVisibleSegmentsToLabelmapNode(segmentationNode, labelmapVolumeNode, referenceVolumeNode)
  filepath = outputPath + "/" + referenceVolumeNode.GetName() + "-label.nrrd"
  slicer.util.saveNode(labelmapVolumeNode, filepath)
  slicer.mrmlScene.RemoveNode(labelmapVolumeNode.GetDisplayNode().GetColorNode())
  slicer.mrmlScene.RemoveNode(labelmapVolumeNode)
  slicer.util.delayDisplay("Segmentation saved to " + filepath)

shortcut = qt.QShortcut(slicer.util.mainWindow())
shortcut.setKey(qt.QKeySequence("Ctrl+Shift+s"))
shortcut.connect( "activated()", exportLabelmap)
Import/export labelmap node using custom label value mapping
While in segmentation nodes segments are identified by segment ID, name, or terminology; in labelmap nodes a segment can be identified only by its label value. Slicer can import a labelmap volume into segmentation, visualize/edit the segmentation, then export the segmentation into labelmap volume - preserving the label values in the output. This is achieved by using a color node during labelmap node import and export, which assigns a name for each label value. Segment corresponding to a label value is found by matching the color name to the segment name.
Create color table node
A color table node can be loaded from a color table file or created from scratch like this:
segment_names_to_labels = [("ribs", 10), ("right lung", 12), ("left lung", 6)]

colorTableNode = slicer.mrmlScene.CreateNodeByClass("vtkMRMLColorTableNode")
colorTableNode.SetTypeToUser()
colorTableNode.HideFromEditorsOff()  # make the color table selectable in the GUI outside Colors module
slicer.mrmlScene.AddNode(colorTableNode); colorTableNode.UnRegister(None)
largestLabelValue = max([name_value[1] for name_value in segment_names_to_labels])
colorTableNode.SetNumberOfColors(largestLabelValue + 1)
import random
for segmentName, labelValue in segment_names_to_labels:
    r = random.uniform(0.0, 1.0)
    g = random.uniform(0.0, 1.0)
    b = random.uniform(0.0, 1.0)
    a = 1.0
    success = colorTableNode.SetColor(labelValue, segmentName, r, g, b, a)
Export labelmap node from segmentation node using custom label value mapping
segmentationNode = getNode('Segmentation')  # source segmentation node
labelmapVolumeNode = slicer.mrmlScene.AddNewNodeByClass("vtkMRMLLabelMapVolumeNode")  # export to new labelmap volume
referenceVolumeNode = None # it could be set to the master volume
segmentIds = segmentationNode.GetSegmentation().GetSegmentIDs()  # export all segments
colorTableNode = ...  # created from scratch or loaded from file

slicer.modules.segmentations.logic().ExportSegmentsToLabelmapNode(segmentationNode, segmentIds, labelmapVolumeNode, referenceVolumeNode, slicer.vtkSegmentation.EXTENT_REFERENCE_GEOMETRY, colorTableNode)
Import labelmap node into segmentation node using custom label value mapping
labelmapVolumeNode = getNode('Volume-label')
segmentationNode = slicer.mrmlScene.AddNewNodeByClass("vtkMRMLSegmentationNode")  # import into new segmentation node
colorTableNode = ...  # created from scratch or loaded from file

labelmapVolumeNode.GetDisplayNode().SetAndObserveColorNodeID(colorTableNode.GetID())  # just in case the custom color table has not been already associated with the labelmap volume
slicer.modules.segmentations.logic().ImportLabelmapToSegmentationNode(labelmapVolumeNode, segmentationNode)
Export model nodes from segmentation node
segmentationNode = getNode("Segmentation")
shNode = slicer.mrmlScene.GetSubjectHierarchyNode()
exportFolderItemId = shNode.CreateFolderItem(shNode.GetSceneItemID(), "Segments")
slicer.modules.segmentations.logic().ExportAllSegmentsToModels(segmentationNode, exportFolderItemId)
Create a hollow model from boundary of solid segment
In most cases, the most robust and flexible tool for creating empty shell models (e.g., vessel wall model from contrast agent segmentation) is the “Hollow” effect in Segment Editor module. However, for very thin shells, extrusion of the exported surface mesh representation may be just as robust and require less memory and computation time. In this case it may be a better approach to to export the segment to a mesh and extrude it along surface normal direction:
Example using Dynamic Modeler module (allows real-time update of parameters, using GUI in Dynamic Modeler module):
segmentationNode = getNode("Segmentation")

# Export segments to models
shNode = slicer.mrmlScene.GetSubjectHierarchyNode()
exportFolderItemId = shNode.CreateFolderItem(shNode.GetSceneItemID(), "Segments")
slicer.modules.segmentations.logic().ExportAllSegmentsToModels(segmentationNode, exportFolderItemId)
segmentModels = vtk.vtkCollection()
shNode.GetDataNodesInBranch(exportFolderItemId, segmentModels)
# Get exported model of first segment
modelNode = segmentModels.GetItemAsObject(0)

# Set up Hollow tool
hollowModeler = slicer.mrmlScene.AddNewNodeByClass("vtkMRMLDynamicModelerNode")
hollowModeler.SetToolName("Hollow")
hollowModeler.SetNodeReferenceID("Hollow.InputModel", modelNode.GetID())
hollowedModelNode = slicer.mrmlScene.AddNewNodeByClass("vtkMRMLModelNode")  # this node will store the hollow model
hollowModeler.SetNodeReferenceID("Hollow.OutputModel", hollowedModelNode.GetID())
hollowModeler.SetAttribute("ShellThickness", "2.5")  # grow outside
hollowModeler.SetContinuousUpdate(True)  # auto-update output model if input parameters are changed

# Hide inputs, show output
segmentationNode.GetDisplayNode().SetVisibility(False)
modelNode.GetDisplayNode().SetVisibility(False)
hollowedModelNode.GetDisplayNode().SetOpacity(0.5)
Example using VTK filters:
# Get closed surface representation of the segment
shellThickness = 3.0  # mm
segmentationNode = getNode("Segmentation")
segmentationNode.CreateClosedSurfaceRepresentation()
polyData = segmentationNode.GetClosedSurfaceInternalRepresentation("Segment_1")

# Create shell
extrude = vtk.vtkLinearExtrusionFilter()
extrude.SetInputData(polyData)
extrude.SetExtrusionTypeToNormalExtrusion()
extrude.SetScaleFactor(shellThickness)

# Compute consistent surface normals
triangle_filter = vtk.vtkTriangleFilter()
triangle_filter.SetInputConnection(extrude.GetOutputPort())
normals = vtk.vtkPolyDataNormals()
normals.SetInputConnection(triangle_filter.GetOutputPort())
normals.FlipNormalsOn()

# Save result into new model node
slicer.modules.models.logic().AddModel(normals.GetOutputPort())
Show a segmentation in 3D
Segmentation can only be shown in 3D if closed surface representation (or other 3D-displayable representation) is available. To create closed surface representation:
segmentation.CreateClosedSurfaceRepresentation()
Modify segmentation display options
segmentation = getNode('Segmentation')
segmentID = 'Segment_1'

displayNode = segmentation.GetDisplayNode()
displayNode.SetOpacity3D(0.4)  # Set overall opacity of the segmentation
displayNode.SetSegmentOpacity3D(segmentID, 0.2)  # Set opacity of a single segment

# Segment color is not just a display property, but it is stored in the segment itself (and stored in the segmentation file)
segment = segmentation.GetSegmentation().GetSegment(segmentID)
segment.SetColor(1, 0, 0)  # red

# In very special cases (for example, when a segment's color only need to be changed in a specific view)
# the segment color can be overridden in the display node.
# This is not recommended for general use.
displayNode.SetSegmentOverrideColor(segmentID, 0, 0, 1)  # blue
Get a representation of a segment
Access binary labelmap stored in a segmentation node (without exporting it to a volume node) - if it does not exist, it will return None:
image = slicer.vtkOrientedImageData()
segmentationNode.GetBinaryLabelmapRepresentation(segmentID, image)
Get closed surface, if it does not exist, it will return None:
outputPolyData = vtk.vtkPolyData()
segmentationNode.GetClosedSurfaceRepresentation(segmentID, outputPolyData)
Get binary labelmap representation. If it does not exist then it will be created for that single segment. Applies parent transforms by default (if not desired, another argument needs to be added to the end: false):
import vtkSegmentationCorePython as vtkSegmentationCore
outputOrientedImageData = vtkSegmentationCore.vtkOrientedImageData()
slicer.vtkSlicerSegmentationsModuleLogic.GetSegmentBinaryLabelmapRepresentation(segmentationNode, segmentID, outputOrientedImageData)
Same as above, for closed surface representation:
outputPolyData = vtk.vtkPolyData()
slicer.vtkSlicerSegmentationsModuleLogic.GetSegmentClosedSurfaceRepresentation(segmentationNode, segmentID, outputPolyData)
Convert all segments using default path and conversion parameters
segmentationNode.CreateBinaryLabelmapRepresentation()
Convert all segments using custom path or conversion parameters
Change reference image geometry parameter based on an existing referenceImageData image:
referenceGeometry = slicer.vtkSegmentationConverter.SerializeImageGeometry(referenceImageData)
segmentation.SetConversionParameter(slicer.vtkSegmentationConverter.GetReferenceImageGeometryParameterName(), referenceGeometry)
Re-convert using a modified conversion parameter
Changing smoothing factor for closed surface generation:
import vtkSegmentationCorePython as vtkSegmentationCore
segmentation = getNode("Segmentation").GetSegmentation()

# Turn of surface smoothing
segmentation.SetConversionParameter("Smoothing factor","0.0")

# Recreate representation using modified parameters (and default conversion path)
segmentation.RemoveRepresentation(vtkSegmentationCore.vtkSegmentationConverter.GetSegmentationClosedSurfaceRepresentationName())
segmentation.CreateRepresentation(vtkSegmentationCore.vtkSegmentationConverter.GetSegmentationClosedSurfaceRepresentationName())
Create keyboard shortcut for toggling sphere brush for paint and erase effects
def toggleSphereBrush():
  segmentEditorWidget = slicer.modules.segmenteditor.widgetRepresentation().self().editor
  paintEffect = segmentEditorWidget.effectByName("Paint")
  isSphere = paintEffect.integerParameter("BrushSphere")
  # BrushSphere is "common" parameter (shared between paint and erase)
  paintEffect.setCommonParameter("BrushSphere", 0 if isSphere else 1)

shortcut = qt.QShortcut(slicer.util.mainWindow())
shortcut.setKey(qt.QKeySequence("s"))
shortcut.connect("activated()", toggleSphereBrush)
Create keyboard shortcut for toggling visibility of a set of segments
This script toggles visibility of “completed” segments if Ctrl-k keyboard shortcut is pressed:
slicer.segmentationNode = getNode('Segmentation')
slicer.toggledSegmentState="completed"  # it could be "inprogress", "completed", "flagged"
slicer.visibility = True

def toggleSegmentVisibility():
    slicer.visibility = not slicer.visibility
    segmentation = slicer.segmentationNode.GetSegmentation()
    for segmentIndex in range(segmentation.GetNumberOfSegments()):
        segmentId = segmentation.GetNthSegmentID(segmentIndex)
        segmentationStatus = vtk.mutable("")
        if not segmentation.GetSegment(segmentId).GetTag("Segmentation.Status", segmentationStatus):
            continue
        if segmentationStatus != slicer.toggledSegmentState:
            continue
        slicer.segmentationNode.GetDisplayNode().SetSegmentVisibility(segmentId, slicer.visibility)

shortcut = qt.QShortcut(slicer.util.mainWindow())
shortcut.setKey(qt.QKeySequence("Ctrl+k"))
shortcut.connect( "activated()", toggleSegmentVisibility)
Customize list of displayed Segment editor effects
Only show Paint and Erase effects:
segmentEditorWidget = slicer.modules.segmenteditor.widgetRepresentation().self().editor
segmentEditorWidget.setEffectNameOrder(["Paint", "Erase"])
segmentEditorWidget.unorderedEffectsVisible = False
Show list of all available effect names:
segmentEditorWidget = slicer.modules.segmenteditor.widgetRepresentation().self().editor
print(segmentEditorWidget.availableEffectNames())
Center all views on a segment
This example shows how to center all slice views and 3D views on a segment. The segment’s center is not the segment’s centroid, but the centroid of the largest island in the effect, because the centroid can be in an empty region if the segment is made up of multiple islands.
segmentationNode = getNode("Segmentation")
segmentId = "Segment_2"

position = segmentationNode.GetSegmentCenterRAS(segmentId)
print(position)

# Center slice views and cameras on this position
for sliceNode in slicer.util.getNodesByClass('vtkMRMLSliceNode'):
    sliceNode.JumpSliceByCentering(*position)
for camera in slicer.util.getNodesByClass('vtkMRMLCameraNode'):
    camera.SetFocalPoint(position)
Read and write a segment as a numpy array
This example shows how to read and write voxels of binary labelmap representation of a segment as a numpy array.
volumeNode = getNode('MRHead')
segmentationNode = getNode('Segmentation')
segmentId = segmentationNode.GetSegmentation().GetSegmentIdBySegmentName('Segment_1')

# Get segment as numpy array
segmentArray = slicer.util.arrayFromSegmentBinaryLabelmap(segmentationNode, segmentId, volumeNode)

# Modify the segmentation
segmentArray[:] = 0  # clear the segmentation
segmentArray[ slicer.util.arrayFromVolume(volumeNode) > 80 ] = 1  # create segment by simple thresholding of an image
segmentArray[20:80, 40:90, 30:70] = 1  # fill a rectangular region using numpy indexing
slicer.util.updateSegmentBinaryLabelmapFromArray(segmentArray, segmentationNode, segmentId, volumeNode)
Segment arrays can also be used in numpy operations to read/write the corresponding region of a volume:
# Get voxels of a volume within the segmentation and compute some statistics
volumeArray = slicer.util.arrayFromVolume(volumeNode)
volumeVoxelsInSegmentArray = volumeArray[ segmentArray > 0 ]
print(f"Lowest voxel value in segment: {volumeVoxelsInSegmentArray.min()}")
print(f"Highest voxel value in segment: {volumeVoxelsInSegmentArray.max()}")

# Modify the volume
# For example, increase the contrast inside the selected segment by a factor of 4x:
volumeArray[ segmentArray > 0 ] = volumeArray[ segmentArray > 0 ] * 4
# Indicate that we have completed modifications on the volume array
slicer.util.arrayFromVolumeModified(volumeNode)
Get centroid of a segment in world (RAS) coordinates
This example shows how to get centroid of a segment in world coordinates and show that position in all slice views.
segmentationNode = getNode("Segmentation")
segmentId = "Segment_1"

# Get array voxel coordinates
import numpy as np
seg = slicer.util.arrayFromSegmentBinaryLabelmap(segmentationNode, segmentId)
# numpy array has voxel coordinates in reverse order (KJI instead of IJK)
# and the array is cropped to minimum size in the segmentation
mean_KjiCropped = [coords.mean() for coords in np.nonzero(seg)]

# Get segmentation voxel coordinates
segImage = slicer.vtkOrientedImageData()
segmentationNode.GetBinaryLabelmapRepresentation(segmentId, segImage)
segImageExtent = segImage.GetExtent()
# origin of the array in voxel coordinates is determined by the start extent
mean_Ijk = [mean_KjiCropped[2], mean_KjiCropped[1], mean_KjiCropped[0]] + np.array([segImageExtent[0], segImageExtent[2], segImageExtent[4]])

# Get segmentation physical coordinates
ijkToWorld = vtk.vtkMatrix4x4()
segImage.GetImageToWorldMatrix(ijkToWorld)
mean_World = [0, 0, 0, 1]
ijkToWorld.MultiplyPoint(np.append(mean_Ijk,1.0), mean_World)
mean_World = mean_World[0:3]

# If segmentation node is transformed, apply that transform to get RAS coordinates
transformWorldToRas = vtk.vtkGeneralTransform()
slicer.vtkMRMLTransformNode.GetTransformBetweenNodes(segmentationNode.GetParentTransformNode(), None, transformWorldToRas)
mean_Ras = transformWorldToRas.TransformPoint(mean_World)

# Show mean position value and jump to it in all slice viewers
print(mean_Ras)
slicer.modules.markups.logic().JumpSlicesToLocation(mean_Ras[0], mean_Ras[1], mean_Ras[2], True)
Get histogram of a segmented region
# Generate example input data (volumeNode, segmentationNode, segmentId)
################################################

# Load source volume
import SampleData
sampleDataLogic = SampleData.SampleDataLogic()
volumeNode = sampleDataLogic.downloadMRBrainTumor1()

# Create segmentation
segmentationNode = slicer.vtkMRMLSegmentationNode()
slicer.mrmlScene.AddNode(segmentationNode)
segmentationNode.CreateDefaultDisplayNodes() # only needed for display
segmentationNode.SetReferenceImageGeometryParameterFromVolumeNode(volumeNode)

# Create segment
tumorSeed = vtk.vtkSphereSource()
tumorSeed.SetCenter(-6, 30, 28)
tumorSeed.SetRadius(25)
tumorSeed.Update()
segmentId = segmentationNode.AddSegmentFromClosedSurfaceRepresentation(tumorSeed.GetOutput(), "Segment A", [1.0,0.0,0.0])

# Compute histogram
################################################

# Get voxel values of volume in the segmented region
import numpy as np
volumeArray = slicer.util.arrayFromVolume(volumeNode)
segmentArray = slicer.util.arrayFromSegmentBinaryLabelmap(segmentationNode, segmentId, volumeNode)
segmentVoxels = volumeArray[segmentArray != 0]

# Compute histogram
import numpy as np
histogram = np.histogram(segmentVoxels, bins=50)

# Plot histogram
################################################

slicer.util.plot(histogram, xColumnIndex = 1)
Get segments visible at a selected position
Show in the console names of segments visible at a markups control point position:
segmentationNode = slicer.mrmlScene.GetFirstNodeByClass("vtkMRMLSegmentationNode")
pointListNode = slicer.mrmlScene.GetFirstNodeByClass("vtkMRMLMarkupsFiducialNode")
sliceViewLabel = "Red"  # any slice view where segmentation node is visible works

def printSegmentNames(unused1=None, unused2=None):

  sliceViewNode = slicer.mrmlScene.GetNodeByID(f"vtkMRMLSliceNode{sliceViewLabel}")
  appLogic = slicer.app.applicationLogic()
  segmentationsDisplayableManager = appLogic.GetViewDisplayableManagerByClassName(sliceViewNode, "vtkMRMLSegmentationsDisplayableManager2D")
  ras = [0,0,0]
  pointListNode.GetNthControlPointPositionWorld(0, ras)
  segmentIds = vtk.vtkStringArray()
  segmentationsDisplayableManager.GetVisibleSegmentsForPosition(ras, segmentationNode.GetDisplayNode(), segmentIds)
  for idIndex in range(segmentIds.GetNumberOfValues()):
    segment = segmentationNode.GetSegmentation().GetSegment(segmentIds.GetValue(idIndex))
    print("Segment found at position {0}: {1}".format(ras, segment.GetName()))

# Observe markup node changes
pointListNode.AddObserver(slicer.vtkMRMLMarkupsNode.PointModifiedEvent, printSegmentNames)
printSegmentNames()
Set default segmentation options
Allow segments to overlap each other by default:
defaultSegmentEditorNode = slicer.vtkMRMLSegmentEditorNode()
defaultSegmentEditorNode.SetOverwriteMode(slicer.vtkMRMLSegmentEditorNode.OverwriteNone)
slicer.mrmlScene.AddDefaultNode(defaultSegmentEditorNode)
To always make this the default, add the lines above to your .slicerrc.py file.
How to run segment editor effects from a script
Editor effects are complex because they need to handle changing source volumes, undo/redo, masking operations, etc. Therefore, it is recommended to use the effect by instantiating a qMRMLSegmentEditorWidget or use/extract processing logic of the effect and use that from a script.
Use Segment editor effects from script (qMRMLSegmentEditorWidget)
Examples:
mask a volume with segments and compute histogram for each region
create fat/muscle/bone segment by thresholding and report volume of each segment
Description of effect parameters are available here.
Use logic of effect from a script
This example shows how to perform operations on segmentations using VTK filters extracted from an effect:
Process segment using a VTK filter
This example shows how to apply a VTK filter to a segment that dilates the image by a specified margin.
segmentationNode = getNode("Segmentation")
segmentId = "Segment_1"
kernelSize = [3,1,5]

# Export segment as vtkImageData (via temporary labelmap volume node)
segmentIds = vtk.vtkStringArray()
segmentIds.InsertNextValue(segmentId)
labelmapVolumeNode = slicer.mrmlScene.AddNewNodeByClass("vtkMRMLLabelMapVolumeNode")
slicer.modules.segmentations.logic().ExportSegmentsToLabelmapNode(segmentationNode, segmentIds, labelmapVolumeNode)

# Process segmentation
segmentImageData = labelmapVolumeNode.GetImageData()
erodeDilate = vtk.vtkImageDilateErode3D()
erodeDilate.SetInputData(segmentImageData)
erodeDilate.SetDilateValue(1)
erodeDilate.SetErodeValue(0)
erodeDilate.SetKernelSize(*kernelSize)
erodeDilate.Update()
segmentImageData.DeepCopy(erodeDilate.GetOutput())

# Import segment from vtkImageData
slicer.modules.segmentations.logic().ImportLabelmapToSegmentationNode(labelmapVolumeNode, segmentationNode, segmentIds)

# Cleanup temporary nodes
slicer.mrmlScene.RemoveNode(labelmapVolumeNode.GetDisplayNode().GetColorNode())
slicer.mrmlScene.RemoveNode(labelmapVolumeNode)
Use segmentation files in Python - outside Slicer
You can use slicerio Python package (in any Python environment, not just within Slicer) to get information from segmentation (.seg.nrrd) files.
For example, a common need when training AI tools is to assemble data sets from various sources, which use different label values for the same segments. If data sets are in .seg.nrrd format, then segment names or standard terminology can be used to identify segments and then assign label values consistently.
Extract selected segments by standard terminology
Segments cannot be reliably identified using “name” (simple string label). Instead, it is recommended to use a standard terminology. This code snippet extracts selected segments from a segmentation and writes the result into a nrrd file.
# pip install slicerio

import slicerio

input_filename = "path/to/Segmentation.seg.nrrd"
output_filename = "path/to/SegmentationExtracted.seg.nrrd"
segments_to_labels = [
   ({"category": ["SCT", "123037004", "Anatomical Structure"], "type": ["SCT", "113197003", "Ribs"]}, 1),
   ({"category": ["SCT", "123037004", "Anatomical Structure"], "type": ["SCT", "39607008", "Lung"], "typeModifier": ["SCT", "24028007", "Right"]}, 3)
   ]

segmentation = slicerio.read_segmentation(input_filename)
extracted_segmentation = slicerio.extract_segments(segmentation, segments_to_labels)
slicerio.write_segmentation(output_filename, extracted_segmentation)
Extract selected segments by segment name
This code snippet extracts selected segments from a segmentation by segment name and writes it into a nrrd file.
# pip install slicerio

import slicerio
import nrrd

input_filename = "path/to/Segmentation.seg.nrrd"
output_filename = "path/to/SegmentationExtracted.seg.nrrd"
segment_names_to_labels = [("ribs", 10), ("right lung", 12), ("left lung", 6)]

# Read voxels and metadata from a .seg.nrrd file
voxels, header = nrrd.read(input_filename)
# Get selected segments in a 3D numpy array and updated segment metadata
extracted_voxels, extracted_header = slicerio.extract_segments(voxels, header, segmentation_info, segment_names_to_labels)
# Write extracted segments and metadata to .seg.nrrd file
nrrd.write(output_filename, extracted_voxels, extracted_header)
Clone a segment
A copy of the segment can be created by using CopySegmentFromSegmentation method:
segmentationNode = getNode("Segmentation")
sourceSegmentName = "Segment_1"

segmentation = segmentationNode.GetSegmentation()
sourceSegmentId = segmentation.GetSegmentIdBySegmentName(sourceSegmentName)
segmentation.CopySegmentFromSegmentation(segmentation, sourceSegmentId)
Resample segmentation to higher resolution
This code snippet can be used to resample internal binary labelmap representation of a segmentation to allow segmenting finer details
# Set inputs
volumeNode = getNode("MRHead")
segmentationNode = getNode("Segmentation")

# The higher the oversampling factor is the finer resolution the segmentation will be,
# at the cost of more memory usage and longer computation times.
# Note that oversampling by a factor of 2 increases memory usage by a factor of 2 * 2 * 2 = 8.
oversamplingFactor = 2.0

# Make spacing value uniform for all axes.
# It is useful for removing staircase artifacts in 3D reconstructions but may increase
# memory usage and computation time.
isotropicSpacing = True

# Update geometry of internal binary labelmap representation in segmentation node
segmentationGeometryLogic = slicer.vtkSlicerSegmentationGeometryLogic()
segmentationGeometryLogic.SetInputSegmentationNode(segmentationNode)
segmentationGeometryLogic.SetSourceGeometryNode(volumeNode)
segmentationGeometryLogic.SetOversamplingFactor(oversamplingFactor)
segmentationGeometryLogic.SetIsotropicSpacing(isotropicSpacing)
segmentationGeometryLogic.CalculateOutputGeometry()
segmentationGeometryLogic.SetReferenceImageGeometryInSegmentationNode()
segmentationGeometryLogic.ResampleLabelmapsInSegmentationNode()
Quantifying segments
Get volume of each segment
segmentationNode = getNode("Segmentation")

# Compute segment statistics
import SegmentStatistics
segStatLogic = SegmentStatistics.SegmentStatisticsLogic()
segStatLogic.getParameterNode().SetParameter("Segmentation", segmentationNode.GetID())
segStatLogic.computeStatistics()
stats = segStatLogic.getStatistics()

# Display volume of each segment
for segmentId in stats["SegmentIDs"]:
  volume_cm3 = stats[segmentId,"LabelmapSegmentStatisticsPlugin.volume_cm3"]
  segmentName = segmentationNode.GetSegmentation().GetSegment(segmentId).GetName()
  print(f"{segmentName} volume = {volume_cm3} cm3")
Get centroid of each segment
Place a markups control point at the centroid of each segment.
segmentationNode = getNode("Segmentation")

# Compute centroids
import SegmentStatistics
segStatLogic = SegmentStatistics.SegmentStatisticsLogic()
segStatLogic.getParameterNode().SetParameter("Segmentation", segmentationNode.GetID())
segStatLogic.getParameterNode().SetParameter("LabelmapSegmentStatisticsPlugin.centroid_ras.enabled", str(True))
segStatLogic.computeStatistics()
stats = segStatLogic.getStatistics()

# Place a markup point in each centroid
pointListNode = slicer.mrmlScene.AddNewNodeByClass("vtkMRMLMarkupsFiducialNode")
pointListNode.CreateDefaultDisplayNodes()
for segmentId in stats["SegmentIDs"]:
  centroid_ras = stats[segmentId,"LabelmapSegmentStatisticsPlugin.centroid_ras"]
  segmentName = segmentationNode.GetSegmentation().GetSegment(segmentId).GetName()
  pointListNode.AddControlPoint(centroid_ras, segmentName)
Get size, position, and orientation of each segment
Get oriented bounding box and display them using markups ROI node.
Markups ROI
segmentationNode = getNode("Segmentation")

# Compute bounding boxes
import SegmentStatistics
segStatLogic = SegmentStatistics.SegmentStatisticsLogic()
segStatLogic.getParameterNode().SetParameter("Segmentation", segmentationNode.GetID())
segStatLogic.getParameterNode().SetParameter("LabelmapSegmentStatisticsPlugin.obb_origin_ras.enabled",str(True))
segStatLogic.getParameterNode().SetParameter("LabelmapSegmentStatisticsPlugin.obb_diameter_mm.enabled",str(True))
segStatLogic.getParameterNode().SetParameter("LabelmapSegmentStatisticsPlugin.obb_direction_ras_x.enabled",str(True))
segStatLogic.getParameterNode().SetParameter("LabelmapSegmentStatisticsPlugin.obb_direction_ras_y.enabled",str(True))
segStatLogic.getParameterNode().SetParameter("LabelmapSegmentStatisticsPlugin.obb_direction_ras_z.enabled",str(True))
segStatLogic.computeStatistics()
stats = segStatLogic.getStatistics()

# Draw ROI for each oriented bounding box
import numpy as np
for segmentId in stats["SegmentIDs"]:
  # Get bounding box
  obb_origin_ras = np.array(stats[segmentId,"LabelmapSegmentStatisticsPlugin.obb_origin_ras"])
  obb_diameter_mm = np.array(stats[segmentId,"LabelmapSegmentStatisticsPlugin.obb_diameter_mm"])
  obb_direction_ras_x = np.array(stats[segmentId,"LabelmapSegmentStatisticsPlugin.obb_direction_ras_x"])
  obb_direction_ras_y = np.array(stats[segmentId,"LabelmapSegmentStatisticsPlugin.obb_direction_ras_y"])
  obb_direction_ras_z = np.array(stats[segmentId,"LabelmapSegmentStatisticsPlugin.obb_direction_ras_z"])
  # Create ROI
  segment = segmentationNode.GetSegmentation().GetSegment(segmentId)
  roi=slicer.mrmlScene.AddNewNodeByClass("vtkMRMLMarkupsROINode")
  roi.SetName(segment.GetName() + " OBB")
  roi.GetDisplayNode().SetHandlesInteractive(False)  # do not let the user resize the box
  roi.SetSize(obb_diameter_mm)
  # Position and orient ROI using a transform
  obb_center_ras = obb_origin_ras+0.5*(obb_diameter_mm[0] * obb_direction_ras_x + obb_diameter_mm[1] * obb_direction_ras_y + obb_diameter_mm[2] * obb_direction_ras_z)
  boundingBoxToRasTransform = np.row_stack((np.column_stack((obb_direction_ras_x, obb_direction_ras_y, obb_direction_ras_z, obb_center_ras)), (0, 0, 0, 1)))
  boundingBoxToRasTransformMatrix = slicer.util.vtkMatrixFromArray(boundingBoxToRasTransform)
  roi.SetAndObserveObjectToNodeMatrix(boundingBoxToRasTransformMatrix)
Note
Complete list of available segment statistics parameters can be obtained by running segStatLogic.getParameterNode().GetParameterNames().
Registration
Register two images with BRAINSFit
Register two brain MRI images of the same patient acquired at different timepoints using BRAINSFit (“General registration (BRAINS)” module).
# Get sample input data
import SampleData
sampleDataLogic = SampleData.SampleDataLogic()
fixedVolumeNode = sampleDataLogic.downloadMRBrainTumor1()
movingVolumeNode = sampleDataLogic.downloadMRBrainTumor2()
# Create new nodes for output
transformedMovingVolumeNode = slicer.mrmlScene.AddNewNodeByClass("vtkMRMLScalarVolumeNode")
transformNode = slicer.mrmlScene.AddNewNodeByClass("vtkMRMLTransformNode")

# Run registration
parameters = {}
parameters["fixedVolume"] = fixedVolumeNode.GetID()
parameters["movingVolume"] = movingVolumeNode.GetID()
parameters["outputVolume"] = transformedMovingVolumeNode.GetID()
parameters["linearTransform"] = transformNode.GetID()
parameters["useRigid"] = True  # options include: "useRigid", "useAffine", "useBSpline"
parameters["initializeTransformMode"] = "useGeometryAlign"
parameters["samplingPercentage"] = 0.02
cliBrainsFitRigidNode = slicer.cli.run(slicer.modules.brainsfit, None, parameters, wait_for_completion=True)

# Display fused result. Computed transformNode is automatically applied to the movingVolumeNode.
# Ctrl + left-click-and-drag up/down to change opacity in slice views.
slicer.util.setSliceViewerLayers(background=fixedVolumeNode, foreground=movingVolumeNode, foregroundOpacity=0.5)
All parameters for BRAINSFit can be found here. The module can register any kind of images, not just brains, but for general-purpose registration extensions consider using more robust registration tools, such as SlicerElastix and SlicerANTs extensions.
Sequences
Access voxels of a 4D volume as numpy array
# Get sequence node
import SampleData
sequenceNode = SampleData.SampleDataLogic().downloadSample("CTPCardioSeq")
# Alternatively, get the first sequence node in the scene:
# sequenceNode = slicer.util.getNodesByClass("vtkMRMLSequenceNode")
# Get voxels of itemIndex'th volume as numpy array
itemIndex = 5
voxelArray = slicer.util.arrayFromVolume(sequenceNode.GetNthDataNode(itemIndex))
Access voxels of a 4D volume as a single numpy array
Get all voxels of a 4D volume (3D volume sequence) as a numpy array called voxelArray. Dimensions of the array: k, j, i, t (first three are voxel coordinates, fourth is the volume index).
sequenceNode = slicer.mrmlScene.GetFirstNodeByClass("vtkMRMLSequenceNode")
# Preallocate a 4D numpy array that will hold the entire sequence
import numpy as np
dims = slicer.util.arrayFromVolume(sequenceNode.GetNthDataNode(0)).shape
voxelArray = np.zeros([dims[0], dims[1], dims[2], sequenceNode.GetNumberOfDataNodes()])
# Fill in the 4D array from the sequence node
for volumeIndex in range(sequenceNode.GetNumberOfDataNodes()):
voxelArray[:, :, :, volumeIndex] = slicer.util.arrayFromVolume(sequenceNode.GetNthDataNode(volumeIndex))
Get index value
print("Index value of {0}th item: {1} = {2} {3}".format(
itemIndex,
sequenceNode.GetIndexName(),
sequenceNode.GetNthIndexValue(itemIndex),
sequenceNode.GetIndexUnit()))
Browse a sequence and access currently displayed nodes
# Get a sequence node
import SampleData
sequenceNode = SampleData.SampleDataLogic().downloadSample("CTPCardioSeq")
# Find corresponding sequence browser node
browserNode = slicer.modules.sequences.logic().GetFirstBrowserNodeForSequenceNode(sequenceNode)
# Print sequence information
print("Number of items in the sequence: {0}".format(browserNode.GetNumberOfItems()))
print("Index name: {0}".format(browserNode.GetMasterSequenceNode().GetIndexName()))
# Jump to a selected sequence item
browserNode.SetSelectedItemNumber(5)
# Get currently displayed volume node voxels as numpy array
volumeNode = browserNode.GetProxyNode(sequenceNode)
voxelArray = slicer.util.arrayFromVolume(volumeNode)
Concatenate all sequences in the scene into a new sequence
# Get all sequence nodes in the scene
sequenceNodes = slicer.util.getNodesByClass("vtkMRMLSequenceNode")
mergedSequenceNode = slicer.mrmlScene.AddNewNodeByClass("vtkMRMLSequenceNode", "Merged sequence")
# Merge all sequence nodes into a new sequence node
mergedIndexValue = 0
for sequenceNode in sequenceNodes:
for itemIndex in range(sequenceNode.GetNumberOfDataNodes()):
dataNode = sequenceNode.GetNthDataNode(itemIndex)
mergedSequenceNode.SetDataNodeAtValue(dataNode, str(mergedIndexValue))
mergedIndexValue += 1
# Delete the sequence node we copied the data from, to prevent sharing of the same
# node by multiple sequences
slicer.mrmlScene.RemoveNode(sequenceNode)
# Create a sequence browser node for the new merged sequence
mergedSequenceBrowserNode = slicer.mrmlScene.AddNewNodeByClass("vtkMRMLSequenceBrowserNode", "Merged")
mergedSequenceBrowserNode.AddSynchronizedSequenceNode(mergedSequenceNode)
slicer.modules.sequences.toolBar().setActiveBrowserNode(mergedSequenceBrowserNode)
# Show proxy node in slice viewers
mergedProxyNode = mergedSequenceBrowserNode.GetProxyNode(mergedSequenceNode)
slicer.util.setSliceViewerLayers(background=mergedProxyNode)
Plot segments average intensity over time
This code snippet can be used to plot average intensity in specific regions (designated using segments in a segmentation node) of a volume sequence over time.
# inputs
volumeSequenceProxyNode = slicer.mrmlScene.GetFirstNodeByClass("vtkMRMLScalarVolumeNode")
segmentationNode = slicer.mrmlScene.GetFirstNodeByClass("vtkMRMLSegmentationNode")
# get volume sequence as numpy array
volumeSequenceBrowserNode = slicer.modules.sequences.logic().GetFirstBrowserNodeForProxyNode(volumeSequenceProxyNode)
volumeSequenceNode = volumeSequenceBrowserNode.GetSequenceNode(volumeSequenceProxyNode)
# get voxels of visible segments as numpy arrays
segmentNames = []
segmentArrays = []
visibleSegmentIds = vtk.vtkStringArray()
segmentationNode.GetDisplayNode().GetVisibleSegmentIDs(visibleSegmentIds)
for segmentIdIndex in range(visibleSegmentIds.GetNumberOfValues()):
segmentId = visibleSegmentIds.GetValue(segmentIdIndex)
segmentArrays.append(slicer.util.arrayFromSegmentBinaryLabelmap(segmentationNode, segmentId, volumeSequenceProxyNode))
segmentNames.append(segmentationNode.GetSegmentation().GetSegment(segmentId).GetName())
# Create table that will contain time values and mean intensity value for each segment for each time point
import numpy as np
intensityTable = np.zeros([volumeSequenceNode.GetNumberOfDataNodes(), len(segmentArrays)+1])
intensityTableTimeColumn = 0
intensityTableColumnNames = [volumeSequenceNode.GetIndexName()] + segmentNames
for volumeIndex in range(volumeSequenceNode.GetNumberOfDataNodes()):
intensityTable[volumeIndex, intensityTableTimeColumn] = volumeSequenceNode.GetNthIndexValue(volumeIndex)
for segmentIndex, segmentArray in enumerate(segmentArrays):
voxelArray = slicer.util.arrayFromVolume(volumeSequenceNode.GetNthDataNode(volumeIndex))
intensityTable[volumeIndex, segmentIndex+1] = voxelArray[segmentArray>0].mean()
# Plot results
plotNodes = {}
slicer.util.plot(intensityTable, intensityTableTimeColumn, intensityTableColumnNames, "Intensity", nodes=plotNodes)
# Set color and name of plots to match segment names and colors
for segmentIdIndex in range(visibleSegmentIds.GetNumberOfValues()):
segment = segmentationNode.GetSegmentation().GetSegment(visibleSegmentIds.GetValue(segmentIdIndex))
seriesNode = plotNodes['series'][segmentIdIndex]
seriesNode.SetColor(segment.GetColor())
seriesNode.SetName(segment.GetName())
Export nodes warped by transform sequence
Warp a segmentation with a sequence of transforms and write each transformed segmentation to a ply file. It can be used on sequence registration results created as shown in this tutorial video.
# Inputs
transformSequenceNode = slicer.util.getNode("OutputTransforms")
segmentationNode = slicer.util.getNode("Segmentation")
segmentIndex = 0
outputFilePrefix = r"c:/tmp/20220312/seg"
# Ensure the segmentation contains closed surface representation
segmentationNode.CreateClosedSurfaceRepresentation()
# Create temporary node that will be warped
segmentModelNode = slicer.mrmlScene.AddNewNodeByClass('vtkMRMLModelNode')
for itemIndex in range(transformSequenceNode.GetNumberOfDataNodes()):
# Get a copy of the segment that will be transformed
segment = segmentationNode.GetSegmentation().GetNthSegment(segmentIndex)
slicer.modules.segmentations.logic().ExportSegmentToRepresentationNode(segment, segmentModelNode)
# Apply the transform
transform = transformSequenceNode.GetNthDataNode(itemIndex).GetTransformToParent()
segmentModelNode.ApplyTransform(transform)
# Write to file
outputFileName = f"{outputFilePrefix}_{itemIndex:03}.ply"
print(outputFileName)
slicer.util.saveNode(segmentModelNode, outputFileName)
# Delete temporary node
slicer.mrmlScene.RemoveNode(segmentModelNode)
Create a 4D volume in Python - outside Slicer
You can write a seq.nrrd file (that Slicer can load as a volume sequence) from an img numpy array of with dimensions t, i, j, k (volume index, followed by voxel coordinates). space origin specifies the image origin. space directions specify the image axis directions and spacing (spacing is the Euclidean norm of the axis vector).
Prerequisite: install pynrrd.
import nrrd
header = {
'type': 'int',
'dimension': 4,
'space': 'right-anterior-superior',
'space directions': [[float('nan'), float('nan'), float('nan')], [1.953125, 0., 0.], [0., 1.953125, 0.], [0., 0., 1.953125]],
'kinds': ['list', 'domain', 'domain', 'domain'],
'labels': ['frame', '', '', ''],
'endian': 'little',
'encoding': 'raw',
'space origin': [-137.16099548, -36.80649948, -309.71899414],
'measurement frame': [[1., 0., 0.], [0., 1., 0.], [0., 0., 1.]],
'axis 0 index type': 'numeric',
'axis 0 index values': '0 1 2 3 4 5 6 7 8 9 10 11 12 13 14 15 16 17 18 19 20 21 22 23 24 25'
}
nrrd.write("c:/tmp/test.seq.nrrd", img, header)
Subject hierarchy
Get the pseudo-singleton subject hierarchy node
It manages the whole hierarchy and provides functions to access and manipulate
shNode = slicer.mrmlScene.GetSubjectHierarchyNode()
Create subject hierarchy item
# If it is for a data node, it is automatically created, but the create function can be used to set parent:
shNode.CreateItem(parentItemID, dataNode)
# If it is a hierarchy item without a data node, then the create function must be used:
shNode.CreateSubjectItem(parentItemID, name)
shNode.CreateFolderItem(parentItemID, name)
shNode.CreateHierarchyItem(parentItemID, name, level) # Advanced method to set level attribute manually (usually subject, study, or folder, but it can be a virtual branch for example)
Get subject hierarchy item
Items in subject hierarchy are uniquely identified by integer IDs
# Get scene item ID first because it is the root item:
sceneItemID = shNode.GetSceneItemID()
# Get direct child by name
subjectItemID = shNode.GetItemChildWithName(sceneItemID, "Subject_1")
# Get item for data node
itemID = shNode.GetItemByDataNode(dataNode)
# Get item by UID (such as DICOM)
itemID = shNode.GetItemByUID(slicer.vtkMRMLSubjectHierarchyConstants.GetDICOMUIDName(), seriesInstanceUid)
itemID = shNode.GetItemByUIDList(slicer.vtkMRMLSubjectHierarchyConstants.GetDICOMInstanceUIDName(), instanceUID)
# Invalid item ID for checking validity of a given ID (most functions return the invalid ID when item is not found)
invalidItemID = slicer.vtkMRMLSubjectHierarchyNode.GetInvalidItemID()
Traverse children of a subject hierarchy item
children = vtk.vtkIdList()
shNode.GetItemChildren(parent, children) # Add a third argument with value True for recursive query
for i in range(children.GetNumberOfIds()):
child = children.GetId(i)
...
Manipulate subject hierarchy item
Instead of node operations on the individual subject hierarchy nodes, item operations are performed on the one subject hierarchy node.
# Set item name
shNode.SetItemName(itemID, "NewName")
# Set item parent (reparent)
shNode.SetItemParent(itemID, newParentItemID)
# Set visibility of data node associated to an item
shNode.SetItemDisplayVisibility(itemID, 1)
# Set visibility of whole branch
# Note: Folder-type items (fodler, subject, study, etc.) create their own display nodes when show/hiding from UI.
# The displayable managers use SH information to determine visibility of an item, so no need to show/hide individual leaf nodes any more.
# Once the folder display node is created, it can be shown hidden simply using shNode.SetItemDisplayVisibility
# From python, this is how to trigger creating a folder display node
pluginHandler = slicer.qSlicerSubjectHierarchyPluginHandler().instance()
folderPlugin = pluginHandler.pluginByName("Folder")
folderPlugin.setDisplayVisibility(folderItemID, 1)
Filter items in TreeView or ComboBox
Displayed items can be filtered using setAttributeFilter method. An example of the usage can be found in the unit test. Modified version here:
print(shTreeView.displayedItemCount()) # 5
shTreeView.setAttributeFilter("DICOM.Modality") # Nodes must have this attribute
print(shTreeView.displayedItemCount()) # 3
shTreeView.setAttributeFilter("DICOM.Modality","CT") # Have attribute and equal ``CT``
print(shTreeView.displayedItemCount()) # 1
shTreeView.removeAttributeFilter()
print(shTreeView.displayedItemCount()) # 5
Listen to subject hierarchy item events
The subject hierarchy node sends the node item id as calldata. Item IDs are vtkIdType, which are NOT vtkObjects. You need to use vtk.calldata_type(vtk.VTK_LONG) (otherwise the application crashes).
class MyListenerClass(VTKObservationMixin):
def __init__(self):
VTKObservationMixin.__init__(self)
shNode = slicer.vtkMRMLSubjectHierarchyNode.GetSubjectHierarchyNode(slicer.mrmlScene)
self.addObserver(shNode, shNode.SubjectHierarchyItemModifiedEvent, self.shItemModifiedEvent)
@vtk.calldata_type(vtk.VTK_LONG)
def shItemModifiedEvent(self, caller, eventId, callData):
print("SH Node modified")
print("SH item ID: {0}".format(callData))
Save files to directory structure matching subject hierarchy folders
This code snippet saves all the storable files (volumes, transforms, markups, etc.) into a folder structure that mirrors the structure of the subject hierarchy tree (file folders have the same name as subject hierarchy folders).
def exportNodes(shFolderItemId, outputFolder):
# Get items in the folder
childIds = vtk.vtkIdList()
shNode = slicer.vtkMRMLSubjectHierarchyNode.GetSubjectHierarchyNode(slicer.mrmlScene)
shNode.GetItemChildren(shFolderItemId, childIds)
if childIds.GetNumberOfIds() == 0:
return
# Create output folder
import os
os.makedirs(outputFolder, exist_ok=True)
# Write each child item to file
for itemIdIndex in range(childIds.GetNumberOfIds()):
shItemId = childIds.GetId(itemIdIndex)
# Write node to file (if storable)
dataNode = shNode.GetItemDataNode(shItemId)
if dataNode and dataNode.IsA("vtkMRMLStorableNode") and dataNode.GetStorageNode():
storageNode = dataNode.GetStorageNode()
filename = os.path.basename(storageNode.GetFileName())
filepath = outputFolder + "/" + filename
slicer.util.exportNode(dataNode, filepath)
# Write all children of this child item
grandChildIds = vtk.vtkIdList()
shNode.GetItemChildren(shItemId, grandChildIds)
if grandChildIds.GetNumberOfIds() > 0:
exportNodes(shItemId, outputFolder+"/"+shNode.GetItemName(shItemId))
shNode = slicer.vtkMRMLSubjectHierarchyNode.GetSubjectHierarchyNode(slicer.mrmlScene)
outputFolder = "c:/tmp/test20211123"
slicer.app.ioManager().addDefaultStorageNodes()
exportNodes(shNode.GetSceneItemID(), outputFolder)
Tractography
Export a tract (FiberBundle) to Blender, including color
Note
An interactive version of this script is now included in the SlicerDMRI extension (module code). After installing SlicerDMRI, go to Modules -> Diffusion -> Import and Export -> Export tractography to PLY (mesh).
The example below shows how to export a tractography “FiberBundleNode” to a PLY file:
lineDisplayNode = getNode("*LineDisplay*")
plyFilePath = "/tmp/fibers.ply"
outputCoordinateSystem = "RAS" # can be "RAS" (still used in neuroimaging) or "LPS" (most commonly used coordinate system in medical image computing)
tuber = vtk.vtkTubeFilter()
tuber.SetInputData(lineDisplayNode.GetOutputPolyData())
tuber.Update()
tubes = tuber.GetOutputDataObject(0)
scalars = tubes.GetPointData().GetArray(0)
scalars.SetName("scalars")
triangles = vtk.vtkTriangleFilter()
triangles.SetInputData(tubes)
triangles.Update()
colorNode = lineDisplayNode.GetColorNode()
lookupTable = vtk.vtkLookupTable()
lookupTable.DeepCopy(colorNode.GetLookupTable())
lookupTable.SetTableRange(0,1)
plyWriter = vtk.vtkPLYWriter()
if outputCoordinateSystem == "RAS":
plyWriter.SetInputData(triangles.GetOutput())
elif outputCoordinateSystem == "LPS":
transformRasToLps = vtk.vtkTransformPolyDataFilter()
rasToLps = vtk.vtkTransform()
rasToLps.Scale(-1, -1, 1)
transformRasToLps.SetTransform(rasToLps)
transformRasToLps.SetInputData(triangles.GetOutput())
plyWriter.SetInputConnection(transformRasToLps.GetOutputPort())
else:
raise RuntimeError("Invalid output coordinate system")
plyWriter.SetLookupTable(lookupTable)
plyWriter.SetArrayName("scalars")
plyWriter.SetFileName(plyFilePath)
plyWriter.Write()
Iterate over tract (FiberBundle) streamline points
This example shows how to access the points in each line of a FiberBundle as a numpy array (view).
from vtk.util.numpy_support import vtk_to_numpy
fb = getNode("FiberBundle_F") # <- fill in node ID here
# get point data as 1d array
points = slicer.util.arrayFromModelPoints(fb)
# get line cell ids as 1d array
line_ids = vtk_to_numpy(fb.GetPolyData().GetLines().GetData())
# VTK cell ids are stored as
# [ N0 c0_id0 ... c0_id0
# N1 c1_id0 ... c1_idN1 ]
# so we need to
# - read point count for each line (cell)
# - grab the ids in that range from `line_ids` array defined above
# - index the `points` array by those ids
cur_idx = 1
for _ in range(pd.GetLines().GetNumberOfCells()):
# - read point count for this line (cell)
count = lines[cur_idx - 1]
# - grab the ids in that range from `lines`
index_array = line_ids[ cur_idx : cur_idx + count]
# update to the next range
cur_idx += count + 1
# - index the point array by those ids
line_points = points[index_array]
# do work here
Transforms
Get a notification if a transform is modified
def onTransformNodeModified(transformNode, unusedArg2=None, unusedArg3=None):
transformMatrix = vtk.vtkMatrix4x4()
transformNode.GetMatrixTransformToWorld(transformMatrix)
print("Position: [{0}, {1}, {2}]".format(transformMatrix.GetElement(0,3), transformMatrix.GetElement(1,3), transformMatrix.GetElement(2,3)))
transformNode = slicer.mrmlScene.AddNewNodeByClass("vtkMRMLTransformNode")
transformNode.AddObserver(slicer.vtkMRMLTransformNode.TransformModifiedEvent, onTransformNodeModified)
Rotate a node around a specified point
Set up the scene:
Add a markup point list node (centerOfRotationMarkupsNode) with a single point to specify center of rotation.
Add a rotation transform (rotationTransformNode) that will be edited in Transforms module to specify rotation angles.
Add a transform (finalTransformNode) and apply it (not harden) to those nodes (images, models, etc.) that you want to rotate around the center of rotation point.
Then run the script below, go to Transforms module, select rotationTransformNode, and move rotation sliders.
# This markups point list node specifies the center of rotation
centerOfRotationMarkupsNode = getNode("F")
# This transform can be edited in Transforms module
rotationTransformNode = getNode("LinearTransform_3")
# This transform has to be applied to the image, model, etc.
finalTransformNode = getNode("LinearTransform_4")
def updateFinalTransform(unusedArg1=None, unusedArg2=None, unusedArg3=None):
rotationMatrix = vtk.vtkMatrix4x4()
rotationTransformNode.GetMatrixTransformToParent(rotationMatrix)
rotationCenterPointCoord = [0.0, 0.0, 0.0]
centerOfRotationMarkupsNode.GetNthControlPointPositionWorld(0, rotationCenterPointCoord)
finalTransform = vtk.vtkTransform()
finalTransform.Translate(rotationCenterPointCoord)
finalTransform.Concatenate(rotationMatrix)
finalTransform.Translate(-rotationCenterPointCoord[0], -rotationCenterPointCoord[1], -rotationCenterPointCoord[2])
finalTransformNode.SetAndObserveMatrixTransformToParent(finalTransform.GetMatrix())
# Manual initial update
updateFinalTransform()
# Automatic update when point is moved or transform is modified
rotationTransformNodeObserver = rotationTransformNode.AddObserver(slicer.vtkMRMLTransformNode.TransformModifiedEvent, updateFinalTransform)
centerOfRotationMarkupsNodeObserver = centerOfRotationMarkupsNode.AddObserver(slicer.vtkMRMLMarkupsNode.PointModifiedEvent, updateFinalTransform)
# Execute these lines to stop automatic updates:
# rotationTransformNode.RemoveObserver(rotationTransformNodeObserver)
# centerOfRotationMarkupsNode.RemoveObserver(centerOfRotationMarkupsNodeObserver)
Rotate a node around a specified line
Set up the scene:
Add a markup line node (rotationAxisMarkupsNode) with 2 points to specify rotation axis.
Add a rotation transform (rotationTransformNode) that will be edited in Transforms module to specify rotation angle.
Add a transform (finalTransformNode) and apply it (not harden) to those nodes (images, models, etc.) that you want to rotate around the line.
Then run the script below, go to Transforms module, select rotationTransformNode, and move Edit / Rotation / IS slider.
# This markups point list node specifies the center of rotation
rotationAxisMarkupsNode = getNode("L")
# This transform can be edited in Transforms module (Edit / Rotation / IS slider)
rotationTransformNode = getNode("LinearTransform_3")
# This transform has to be applied to the image, model, etc.
finalTransformNode = getNode("LinearTransform_4")
def updateFinalTransform(unusedArg1=None, unusedArg2=None, unusedArg3=None):
import numpy as np
rotationAxisPoint1_World = np.zeros(3)
rotationAxisMarkupsNode.GetNthControlPointPositionWorld(0, rotationAxisPoint1_World)
rotationAxisPoint2_World = np.zeros(3)
rotationAxisMarkupsNode.GetNthControlPointPositionWorld(1, rotationAxisPoint2_World)
axisDirectionZ_World = rotationAxisPoint2_World-rotationAxisPoint1_World
axisDirectionZ_World = axisDirectionZ_World/np.linalg.norm(axisDirectionZ_World)
# Get transformation between world coordinate system and rotation axis aligned coordinate system
worldToRotationAxisTransform = vtk.vtkMatrix4x4()
p=vtk.vtkPlaneSource()
p.SetNormal(axisDirectionZ_World)
axisOrigin = np.array(p.GetOrigin())
axisDirectionX_World = np.array(p.GetPoint1())-axisOrigin
axisDirectionY_World = np.array(p.GetPoint2())-axisOrigin
rotationAxisToWorldTransform = np.row_stack((np.column_stack((axisDirectionX_World, axisDirectionY_World, axisDirectionZ_World, rotationAxisPoint1_World)), (0, 0, 0, 1)))
rotationAxisToWorldTransformMatrix = slicer.util.vtkMatrixFromArray(rotationAxisToWorldTransform)
worldToRotationAxisTransformMatrix = slicer.util.vtkMatrixFromArray(np.linalg.inv(rotationAxisToWorldTransform))
# Compute transformation chain
rotationMatrix = vtk.vtkMatrix4x4()
rotationTransformNode.GetMatrixTransformToParent(rotationMatrix)
finalTransform = vtk.vtkTransform()
finalTransform.Concatenate(rotationAxisToWorldTransformMatrix)
finalTransform.Concatenate(rotationMatrix)
finalTransform.Concatenate(worldToRotationAxisTransformMatrix)
finalTransformNode.SetAndObserveMatrixTransformToParent(finalTransform.GetMatrix())
# Manual initial update
updateFinalTransform()
# Automatic update when point is moved or transform is modified
rotationTransformNodeObserver = rotationTransformNode.AddObserver(slicer.vtkMRMLTransformNode.TransformModifiedEvent, updateFinalTransform)
rotationAxisMarkupsNodeObserver = rotationAxisMarkupsNode.AddObserver(slicer.vtkMRMLMarkupsNode.PointModifiedEvent, updateFinalTransform)
# Execute these lines to stop automatic updates:
# rotationTransformNode.RemoveObserver(rotationTransformNodeObserver)
# rotationAxisMarkupsNode.RemoveObserver(rotationAxisMarkupsNodeObserver)
Convert between ITK and Slicer linear transforms
ITK transform files store the resampling transform (“transform from parent”) in LPS coordinate system. Slicer displays the modeling transform (“transform to parent”) in RAS coordinate system. The following code snippets show how to compute the matrix that Slicer displays from an ITK transform file.
# Copy the content between the following triple-quotes to a file called 'LinearTransform.tfm', and load into Slicer
"""
#Insight Transform File V1.0
#Transform 0
Transform: AffineTransform_double_3_3
Parameters: -0.213789703753722 -0.7715409537503184 0.5991815411500568 -0.6877744504386172 0.5544585467133546 0.46855311897413043 -0.6937292468195099 -0.3119299226790803 -0.6491836839020759 -6.080443282989144 10.318378593490745 159.38003926210894
FixedParameters: -4.363375593759671 -23.302979114450725 -56.27550193307294
"""
import numpy as np
import re
def read_itk_affine_transform(filename):
with open(filename, 'r') as f:
lines = f.readlines()
# Extract Parameters
params_line = next(line for line in lines if line.startswith('Parameters:'))
params = list(map(float, params_line.removeprefix('Parameters:').strip().split()))
rotation = np.array(params[:9]).reshape((3, 3))
translation = np.array(params[9:12])
# Extract FixedParameters (center of rotation)
fixed_params_line = next(line for line in lines if line.startswith('FixedParameters:'))
rotation_center = np.array(list(map(float, fixed_params_line.removeprefix('FixedParameters:').strip().split())))
# Get homogeneous transformation matrix translation component from transform parameters and fixed parameters.
# The homogeneous transformation matrix rotation part is the same as rotation stored in parameters.
# However, the translation part is not directly stored in these values, but it is computed from the fixed and moving parameters (and the value is called "offset").
# See computation implementation in MatrixOffsetTransformBase::ComputeOffset
# https://github.com/InsightSoftwareConsortium/ITK/blob/09305ce7c3509139ab0ca12047f8e6793b01db74/Modules/Core/Transform/include/itkMatrixOffsetTransformBase.hxx#L611-L629
offset = translation + rotation_center - rotation @ rotation_center
# Construct homogeneous transformation matrix
transform = np.eye(4)
transform[:3, :3] = rotation
transform[:3, 3] = offset
return transform
def itk_to_slicer_transform(itk_transform):
# ITK transform: from parent, using LPS coordinate system
# Transform displayed in Slicer: to parent, using RAS coordinate system
transform_from_parent_LPS = itk_transform
ras2lps = np.diag([-1, -1, 1, 1])
transform_from_parent_RAS = ras2lps @ transform_from_parent_LPS @ ras2lps
transform_to_parent_RAS = np.linalg.inv(transform_from_parent_RAS)
return transform_to_parent_RAS
filename = "path/to/LinearTransform.tfm"
itk_tfm = read_itk_affine_transform(filename)
slicer_tfm = itk_to_slicer_transform(itk_tfm)
with np.printoptions(precision=6, suppress=True):
print(slicer_tfm)
# Running the code above in Python should print the following output.
# This output should match the display the loaded .tfm file in the Transforms module:
# [[ 0.929794 -0.269457 -0.25075 -52.64097 ]
# [ 0.038348 0.748446 -0.662086 46.126957]
# [ 0.366077 0.605988 0.706234 0.481854]
# [ 0. 0. 0. 1. ]]
Apply a transform to a transformable node
Python:
transformToParentMatrix = vtk.vtkMatrix4x4()
...
transformNode.SetMatrixTransformToParent(matrix)
transformableNode.SetAndObserveTransformNodeID(transformNode.GetID())
C++:
vtkNew<vtkMRMLTransformNode> transformNode;
scene->AddNode(transformNode.GetPointer());
...
vtkNew<vtkMatrix4x4> matrix;
...
transform->SetMatrixTransformToParent( matrix.GetPointer() );
...
vtkMRMLVolumeNode* transformableNode = ...; // or vtkMRMLModelNode*...
transformableNode->SetAndObserveTransformNodeID( transformNode->GetID() );
Set a transformation matrix from a numpy array
# Create a 4x4 transformation matrix as numpy array
transformNode = ...
transformMatrixNP = np.array(
[[0.92979,-0.26946,-0.25075,52.64097],
[0.03835, 0.74845, -0.66209, -46.12696],
[0.36608, 0.60599, 0.70623, -0.48185],
[0, 0, 0, 1]])
# Update matrix in transform node
transformNode.SetAndObserveMatrixTransformToParent(slicer.util.vtkMatrixFromArray(transformMatrixNP))
Example of moving a volume along a trajectory using a transform
# Load sample volume
import SampleData
sampleDataLogic = SampleData.SampleDataLogic()
mrHead = sampleDataLogic.downloadMRHead()
# Create transform and apply to sample volume
transformNode = slicer.vtkMRMLTransformNode()
slicer.mrmlScene.AddNode(transformNode)
mrHead.SetAndObserveTransformNodeID(transformNode.GetID())
# How to move a volume along a trajectory using a transform:
import time
import math
transformMatrix = vtk.vtkMatrix4x4()
for xPos in range(-30,30):
transformMatrix.SetElement(0,3, xPos)
transformMatrix.SetElement(1,3, math.sin(xPos)*10)
transformNode.SetMatrixTransformToParent(transformMatrix)
slicer.app.processEvents()
time.sleep(0.02)
# Note: for longer animations use qt.QTimer.singleShot(100, callbackFunction)
# instead of a for loop.
Combine multiple transforms
Because a transform node is also a transformable node, it is possible to concatenate transforms with each other.
Python:
transformNode2.SetAndObserveTransformNodeID(transformNode1.GetID())
transformableNode.SetAndObserveTransformNodeID(transformNode2.GetID())
C++:
vtkMRMLTransformNode* transformNode1 = ...;
vtkMRMLTransformNode* transformNode2 = ...;
transformNode2->SetAndObserveTransformNodeID(transformNode1->GetID());
transformable->SetAndObserveTransformNodeID(transformNode2->GetID());
Convert the transform to a grid transform
Any transform can be converted to a grid transform (also known as displacement field transform):
transformNode=slicer.util.getNode('LinearTransform_3')
referenceVolumeNode=slicer.util.getNode('MRHead')
slicer.modules.transforms.logic().ConvertToGridTransform(transformNode, referenceVolumeNode)
Note
Conversion to grid transform is useful because some software cannot use inverse transforms or can only use grid transforms.
Displacement field transforms are saved to file differently than displacement field volumes: displacement vectors in transforms are converted to LPS coordinate system on saving, displacement vectors in volumes are saved to file unchanged.
Export the displacement magnitude of the transform as a volume
transformNode=slicer.util.getNode('LinearTransform_3')
referenceVolumeNode=slicer.util.getNode('MRHead')
slicer.modules.transforms.logic().CreateDisplacementVolumeFromTransform(transformNode, referenceVolumeNode, False)
Visualize the displacement magnitude as a color volume
transformNode=slicer.util.getNode('LinearTransform_3')
referenceVolumeNode=slicer.util.getNode('MRHead')
slicer.modules.transforms.logic().CreateDisplacementVolumeFromTransform(transformNode, referenceVolumeNode, True)
Volumes
Load volume from file
loadedVolumeNode = slicer.util.loadVolume("c:/Users/abc/Documents/MRHead.nrrd")
Additional options may be specified in properties argument. For example, load an image stack by disabling singleFile option:
loadedVolumeNode = slicer.util.loadVolume("c:/Users/abc/Documents/SomeImage/file001.png", {"singleFile": False})
Note
The following options can be passed to load volumes programmatically when using qSlicerVolumesReader:
name(string): Node name to set for the loaded volumelabelmap(bool, default=false): Load the file as labelmap volumesingleFile(bool, default=false): Force loading this file only (otherwise the loader may look for similar files in the same folder to load multiple slices as a 3D volume)autoWindowLevel(bool, default=true): Automatically compute the window level based on the volume pixel intensitiesshow(bool, default=true): Show the volume in views after loadingcenter(bool, default=false): Apply a transform that places the volume in the patient coordinate system origindiscardOrientation(bool, default=false): Discard file orientation information.fileNames(string list): List of files to be loaded as a volumecolorNodeID(string): ID of the color node used to display the volume. Default isvtkMRMLColorTableNodeGreyfor scalar volume andvtkMRMLColorTableNodeFileGenericColors.txtfor labelmap volume.
Save volume to file
Get the first volume node in the scene and save as .nrrd file. To save in any other supported file format, change the output file name.
volumeNode = slicer.mrmlScene.GetFirstNodeByClass('vtkMRMLScalarVolumeNode')
slicer.util.exportNode(volumeNode, "c:/tmp/test.nrrd")
If you are saving to a format with optional compression, like nrrd, compression is on by default. Saving is much faster with compression turned off but the files may be much larger (about 3x for medical images).
slicer.util.exportNode(volumeNode, imagePath, {"useCompression": 0})
By default, parent transforms are ignored. To export the node in the world coordinate system (all transforms hardened), set world=True.
slicer.util.exportNode(volumeNode, imagePath, {"useCompression": 0}, world=True)
saveNode method can be used instead of exportNode to update the current storage options (filename, compression options, etc.) in the scene.
Load volume from .vti file
Slicer does not provide reader for VTK XML image data file format (as they are not commonly used for storing medical images and they cannot store image axis directions) but such files can be read by using this script:
reader=vtk.vtkXMLImageDataReader()
reader.SetFileName("/path/to/file.vti")
reader.Update()
imageData = reader.GetOutput()
spacing = imageData.GetSpacing()
origin = imageData.GetOrigin()
imageData.SetOrigin(0,0,0)
imageData.SetSpacing(1,1,1)
volumeNode=slicer.mrmlScene.AddNewNodeByClass("vtkMRMLScalarVolumeNode")
volumeNode.SetAndObserveImageData(imageData)
volumeNode.SetSpacing(spacing)
volumeNode.SetOrigin(origin)
slicer.util.setSliceViewerLayers(background=volumeNode, fit=True)
Load volume from a remote server
Download a volume from a remote server by an URL and load it into the scene using the code snippets below.
Note
Downloaded data is temporarily stored in the application’s cache folder and if the checksum of the already downloaded data
matches the specified checksum (:) then the file is retrieved from the cache instead of being downloaded
again. To compute digest with algo SHA256, you can run slicer.util.computeChecksum("SHA256", "path/to/file")().
Simple download
import SampleData
sampleDataLogic = SampleData.SampleDataLogic()
loadedNodes = sampleDataLogic.downloadFromURL(
nodeNames="MRHead",
fileNames="MR-head25.nrrd",
uris="https://github.com/Slicer/SlicerTestingData/releases/download/SHA256/cc211f0dfd9a05ca3841ce1141b292898b2dd2d3f08286affadf823a7e58df93",
checksums="SHA256:cc211f0dfd9a05ca3841ce1141b292898b2dd2d3f08286affadf823a7e58df93")[0]
Download with interruptible progress reporting
import SampleData
def reportProgress(msg, level=None):
# Print progress in the console
print("Loading... {0}%".format(sampleDataLogic.downloadPercent))
# Abort download if cancel is clicked in progress bar
if slicer.progressWindow.wasCanceled:
raise Exception("download aborted")
# Update progress window
slicer.progressWindow.show()
slicer.progressWindow.activateWindow()
slicer.progressWindow.setValue(int(sampleDataLogic.downloadPercent))
slicer.progressWindow.setLabelText("Downloading...")
# Process events to allow screen to refresh
slicer.app.processEvents()
try:
volumeNode = None
slicer.progressWindow = slicer.util.createProgressDialog()
sampleDataLogic = SampleData.SampleDataLogic()
sampleDataLogic.logMessage = reportProgress
loadedNodes = sampleDataLogic.downloadFromURL(
nodeNames="MRHead",
fileNames="MR-head25.nrrd",
uris="https://github.com/Slicer/SlicerTestingData/releases/download/SHA256/cc211f0dfd9a05ca3841ce1141b292898b2dd2d3f08286affadf823a7e58df93",
checksums="SHA256:cc211f0dfd9a05ca3841ce1141b292898b2dd2d3f08286affadf823a7e58df93")
volumeNode = loadedNodes[0]
finally:
slicer.progressWindow.close()
Show volume rendering automatically when a volume is loaded
To show volume rendering of a volume automatically when it is loaded, add the lines below to your .slicerrc.py file.
@vtk.calldata_type(vtk.VTK_OBJECT)
def onNodeAdded(caller, event, calldata):
node = calldata
if isinstance(node, slicer.vtkMRMLVolumeNode):
# Call showVolumeRendering using a timer instead of calling it directly
# to allow the volume loading to fully complete.
qt.QTimer.singleShot(0, lambda: showVolumeRendering(node))
def showVolumeRendering(volumeNode):
print("Show volume rendering of node " + volumeNode.GetName())
volRenLogic = slicer.modules.volumerendering.logic()
displayNode = volRenLogic.CreateDefaultVolumeRenderingNodes(volumeNode)
displayNode.SetVisibility(True)
scalarRange = volumeNode.GetImageData().GetScalarRange()
if scalarRange[1]-scalarRange[0] < 1500:
# Small dynamic range, probably MRI
displayNode.GetVolumePropertyNode().Copy(volRenLogic.GetPresetByName("MR-Default"))
else:
# Larger dynamic range, probably CT
displayNode.GetVolumePropertyNode().Copy(volRenLogic.GetPresetByName("CT-Chest-Contrast-Enhanced"))
slicer.mrmlScene.AddObserver(slicer.vtkMRMLScene.NodeAddedEvent, onNodeAdded)
Show volume rendering using maximum intensity projection
def showVolumeRenderingMIP(volumeNode, useSliceViewColors=True):
"""Render volume using maximum intensity projection
:param useSliceViewColors: use the same colors as in slice views.
"""
# Get/create volume rendering display node
volRenLogic = slicer.modules.volumerendering.logic()
displayNode = volRenLogic.GetFirstVolumeRenderingDisplayNode(volumeNode)
if not displayNode:
displayNode = volRenLogic.CreateDefaultVolumeRenderingNodes(volumeNode)
# Choose MIP volume rendering preset
if useSliceViewColors:
volRenLogic.CopyDisplayToVolumeRenderingDisplayNode(displayNode)
else:
scalarRange = volumeNode.GetImageData().GetScalarRange()
if scalarRange[1]-scalarRange[0] < 1500:
# Small dynamic range, probably MRI
displayNode.GetVolumePropertyNode().Copy(volRenLogic.GetPresetByName("MR-MIP"))
else:
# Larger dynamic range, probably CT
displayNode.GetVolumePropertyNode().Copy(volRenLogic.GetPresetByName("CT-MIP"))
# Switch views to MIP mode
for viewNode in slicer.util.getNodesByClass("vtkMRMLViewNode"):
viewNode.SetRaycastTechnique(slicer.vtkMRMLViewNode.MaximumIntensityProjection)
# Show volume rendering
displayNode.SetVisibility(True)
volumeNode = slicer.mrmlScene.GetFirstNodeByClass("vtkMRMLScalarVolumeNode")
showVolumeRenderingMIP(volumeNode)
Show volume rendering making soft tissues transparent
def showTransparentRendering(volumeNode, maxOpacity=0.2, gradientThreshold=30.0):
"""Make constant regions transparent and the entire volume somewhat transparent
:param maxOpacity: lower value makes the volume more transparent overall
(value is between 0.0 and 1.0)
:param gradientThreshold: regions that has gradient value below this threshold will be made transparent
(minimum value is 0.0, higher values make more tissues transparent, starting with soft tissues)
"""
# Get/create volume rendering display node
volRenLogic = slicer.modules.volumerendering.logic()
displayNode = volRenLogic.GetFirstVolumeRenderingDisplayNode(volumeNode)
if not displayNode:
displayNode = volRenLogic.CreateDefaultVolumeRenderingNodes(volumeNode)
# Set up gradient vs opacity transfer function
gradientOpacityTransferFunction = displayNode.GetVolumePropertyNode().GetVolumeProperty().GetGradientOpacity()
gradientOpacityTransferFunction.RemoveAllPoints()
gradientOpacityTransferFunction.AddPoint(0, 0.0)
gradientOpacityTransferFunction.AddPoint(gradientThreshold-1, 0.0)
gradientOpacityTransferFunction.AddPoint(gradientThreshold+1, maxOpacity)
# Show volume rendering
displayNode.SetVisibility(True)
volumeNode = slicer.mrmlScene.GetFirstNodeByClass("vtkMRMLScalarVolumeNode")
showTransparentRendering(volumeNode, 0.2, 30.0)
Automatically load volumes that are copied into a folder
This example shows how to implement a simple background task by using a timer. The background task is to check for any new volume files in folder and if there is any then automatically load it.
There are more efficient methods for file system monitoring or exchanging image data in real-time (for example, using OpenIGTLink), the example below is just for demonstration purposes.
incomingVolumeFolder = "c:/tmp/incoming"
incomingVolumesProcessed = []
def checkForNewVolumes():
# Check if there is a new file in the
from os import listdir
from os.path import isfile, join
for f in listdir(incomingVolumeFolder):
if f in incomingVolumesProcessed:
# This is an incoming file, it was already there
continue
filePath = join(incomingVolumeFolder, f)
if not isfile(filePath):
# ignore directories
continue
logging.info("Loading new file: " + f)
incomingVolumesProcessed.append(f)
slicer.util.loadVolume(filePath)
# Check again in 3000ms
qt.QTimer.singleShot(3000, checkForNewVolumes)
# Start monitoring
checkForNewVolumes()
Extract slice from volume
This code snippet can extract arbitrarily oriented slice from a volume. The slice position, orientation, and size is specified by a markup plane node.
# Inputs
volumeNode = slicer.mrmlScene.GetFirstNodeByClass("vtkMRMLScalarVolumeNode") # input 3D volume
planeNode = slicer.mrmlScene.GetFirstNodeByClass("vtkMRMLMarkupsPlaneNode") # input markup plane
spacing = [0.5, 0.5, 1.0] # spacing of the extracted image slice
# Create slice image node
sliceImageNode = slicer.mrmlScene.AddNewNodeByClass("vtkMRMLScalarVolumeNode")
sliceImageNode.CreateDefaultDisplayNodes()
imageData = vtk.vtkImageData()
sliceImageNode.SetAndObserveImageData(imageData)
# Set image size
sizeWorld = planeNode.GetSizeWorld()
imageData.SetExtent(0, int(sizeWorld[0]/spacing[0]-1), 0, int(sizeWorld[1]/spacing[1]-1), 0, 0)
imageData.AllocateScalars(vtk.VTK_UNSIGNED_CHAR, 1)
# Set spacing
sliceImageNode.SetSpacing(spacing)
# Set directions
import numpy as np
ijkToRASDirections = np.eye(3)
planeNode.GetAxesWorld(ijkToRASDirections[0:3, 0], ijkToRASDirections[0:3, 1], ijkToRASDirections[0:3, 2])
sliceImageNode.SetIJKToRASDirections(ijkToRASDirections)
# Set origin
origin = np.array(planeNode.GetCenter()) - ijkToRASDirections[0:3, 0] * sizeWorld[0] / 2 - ijkToRASDirections[0:3, 1] * sizeWorld[1] / 2
sliceImageNode.SetOrigin(origin)
# Resample the volume to the slice image node
referenceVolumeNode = sliceImageNode
parameters = {
"inputVolume": volumeNode.GetID(),
"outputVolume": sliceImageNode.GetID(),
"referenceVolume": sliceImageNode.GetID(),
"interpolationType": "linear"
}
parameterNode = slicer.cli.run(slicer.modules.resamplescalarvectordwivolume, None, parameters, wait_for_completion=True, update_display=False)
slicer.mrmlScene.RemoveNode(parameterNode)
Extract randomly oriented slabs of given shape from a volume
Returns a numpy array of sliceCount random tiles.
def randomSlices(volume, sliceCount, sliceShape):
layoutManager = slicer.app.layoutManager()
redWidget = layoutManager.sliceWidget("Red")
sliceNode = redWidget.mrmlSliceNode()
sliceNode.SetDimensions(*sliceShape, 1)
sliceNode.SetFieldOfView(*sliceShape, 1)
bounds = [0]*6
volume.GetRASBounds(bounds)
imageReslice = redWidget.sliceLogic().GetBackgroundLayer().GetReslice()
sliceSize = sliceShape[0] * sliceShape[1]
X = numpy.zeros([sliceCount, sliceSize])
for sliceIndex in range(sliceCount):
position = numpy.random.rand(3) * 2 - 1
position = [bounds[0] + bounds[1]-bounds[0] * position[0],
bounds[2] + bounds[3]-bounds[2] * position[1],
bounds[4] + bounds[5]-bounds[4] * position[2]]
normal = numpy.random.rand(3) * 2 - 1
normal = normal / numpy.linalg.norm(normal)
transverse = numpy.cross(normal, [0,0,1])
orientation = 0
sliceNode.SetSliceToRASByNTP( normal[0], normal[1], normal[2],
transverse[0], transverse[1], transverse[2],
position[0], position[1], position[2],
orientation)
if sliceIndex % 100 == 0:
slicer.app.processEvents()
imageReslice.Update()
imageData = imageReslice.GetOutputDataObject(0)
array = vtk.util.numpy_support.vtk_to_numpy(imageData.GetPointData().GetScalars())
X[sliceIndex] = array
return X
Clone a volume
This example shows how to clone the MRHead sample volume, including its pixel data and display settings.
sourceVolumeNode = slicer.util.getNode("MRHead")
volumesLogic = slicer.modules.volumes.logic()
clonedVolumeNode = volumesLogic.CloneVolume(slicer.mrmlScene, sourceVolumeNode, "Cloned volume")
Create a new volume
This example shows how to create a new empty volume. The “Image Maker” extension contains a module that allows creating a volume from scratch without programming.
nodeName = "MyNewVolume"
imageSize = [512, 512, 512]
voxelType=vtk.VTK_UNSIGNED_CHAR
imageOrigin = [0.0, 0.0, 0.0]
imageSpacing = [1.0, 1.0, 1.0]
imageDirections = [[1,0,0], [0,1,0], [0,0,1]]
fillVoxelValue = 0
# Create an empty image volume, filled with fillVoxelValue
imageData = vtk.vtkImageData()
imageData.SetDimensions(imageSize)
imageData.AllocateScalars(voxelType, 1)
imageData.GetPointData().GetScalars().Fill(fillVoxelValue)
# Create volume node
volumeNode = slicer.mrmlScene.AddNewNodeByClass("vtkMRMLScalarVolumeNode", nodeName)
volumeNode.SetOrigin(imageOrigin)
volumeNode.SetSpacing(imageSpacing)
volumeNode.SetIJKToRASDirections(imageDirections)
volumeNode.SetAndObserveImageData(imageData)
volumeNode.CreateDefaultDisplayNodes()
volumeNode.CreateDefaultStorageNode()
C++:
vtkNew<vtkImageData> imageData;
imageData->SetDimensions(10,10,10); // image size
imageData->AllocateScalars(VTK_UNSIGNED_CHAR, 1); // image type and number of components
// initialize the pixels here
vtkNew<vtkMRMLScalarVolumeNode> volumeNode;
volumeNode->SetAndObserveImageData(imageData);
volumeNode->SetOrigin( -10., -10., -10.);
volumeNode->SetSpacing( 2., 2., 2. );
mrmlScene->AddNode( volumeNode.GetPointer() );
volumeNode->CreateDefaultDisplayNodes()
Note
Origin and spacing must be set on the volume node instead of the image data.
Create a new volume from ROI
This example shows how to create a new empty volume with a specified voxel size, with axis directions and extents set from a markups ROI node.
def createVolumeFromRoi(exportRoi, spacingMm, fillValue=0, numberOfComponents=1):
import math
roiDiameter = exportRoi.GetSize()
roiOrigin_Roi = [-roiDiameter[0]/2, -roiDiameter[1]/2, -roiDiameter[2]/2, 1]
roiToRas = exportRoi.GetObjectToWorldMatrix()
exportVolumeSize = [int(math.ceil(diameterComponent/spacingMm)) for diameterComponent in roiDiameter]
# Create image data
exportImageData = vtk.vtkImageData()
exportImageData.SetExtent(0, exportVolumeSize[0]-1, 0, exportVolumeSize[1]-1, 0, exportVolumeSize[2]-1)
exportImageData.AllocateScalars(vtk.VTK_DOUBLE, numberOfComponents)
exportImageData.GetPointData().GetScalars().Fill(fillValue)
# Create volume node
exportVolume = slicer.mrmlScene.AddNewNodeByClass("vtkMRMLScalarVolumeNode" if numberOfComponents==1 else "vtkMRMLVectorVolumeNode")
exportVolume.SetAndObserveImageData(exportImageData)
exportVolume.SetIJKToRASDirections(roiToRas.GetElement(0,0), roiToRas.GetElement(0,1), roiToRas.GetElement(0,2), roiToRas.GetElement(1,0), roiToRas.GetElement(1,1), roiToRas.GetElement(1,2), roiToRas.GetElement(2,0), roiToRas.GetElement(2,1), roiToRas.GetElement(2,2))
exportVolume.SetSpacing(spacingMm, spacingMm, spacingMm)
roiOrigin_Ras = roiToRas.MultiplyPoint(roiOrigin_Roi)
exportVolume.SetOrigin(roiOrigin_Ras[0:3])
return exportVolume
# Create volume node from ROI node "R"
roiNode = getNode('R')
volumeNode = createVolumeFromRoi(roiNode, 0.5, 120)
# Show in slice views and set its window/level
slicer.util.setSliceViewerLayers(background=volumeNode)
volumeNode.GetScalarVolumeDisplayNode().AutoWindowLevelOff()
volumeNode.GetScalarVolumeDisplayNode().SetWindowLevel(110,130)
Get value of a volume at specific voxel coordinates
This example shows how to get voxel value of “volumeNode” at “ijk” volume voxel coordinates.
volumeNode = slicer.util.getNode("MRHead")
ijk = [20,40,30] # volume voxel coordinates
voxels = slicer.util.arrayFromVolume(volumeNode) # get voxels as a numpy array
voxelValue = voxels[ijk[2], ijk[1], ijk[0]] # note that numpy array index order is kji (not ijk)
Modify voxels in a volume
Typically the fastest and simplest way of modifying voxels is by using numpy operators. Voxels can be retrieved in a numpy array using the array method and modified using standard numpy methods. For example, threshold a volume:
nodeName = "MRHead"
thresholdValue = 100
voxelArray = array(nodeName) # get voxels as numpy array
voxelArray[voxelArray < thresholdValue] = 0 # modify voxel values
getNode(nodeName).Modified() # at the end of all processing, notify Slicer that the image modification is completed
This example shows how to change voxels values of the MRHead sample volume. The values will be computed by function f(r,a,s,) = (r-10)*(r-10)+(a+15)*(a+15)+s*s.
volumeNode=slicer.util.getNode("MRHead")
ijkToRas = vtk.vtkMatrix4x4()
volumeNode.GetIJKToRASMatrix(ijkToRas)
imageData=volumeNode.GetImageData()
extent = imageData.GetExtent()
for k in range(extent[4], extent[5]+1):
for j in range(extent[2], extent[3]+1):
for i in range(extent[0], extent[1]+1):
position_Ijk=[i, j, k, 1]
position_Ras=ijkToRas.MultiplyPoint(position_Ijk)
r=position_Ras[0]
a=position_Ras[1]
s=position_Ras[2]
functionValue=(r-10)*(r-10)+(a+15)*(a+15)+s*s
imageData.SetScalarComponentFromDouble(i,j,k,0,functionValue)
imageData.Modified()
Get volume voxel coordinates from markup control point RAS coordinates
This example shows how to get voxel coordinate of a volume corresponding to a markup control point position.
# Inputs
volumeNode = getNode("MRHead")
pointListNode = getNode("F")
markupsIndex = 0
# Get point coordinate in RAS
point_Ras = [0, 0, 0]
pointListNode.GetNthControlPointPositionWorld(markupsIndex, point_Ras)
# If volume node is transformed, apply that transform to get volume's RAS coordinates
transformRasToVolumeRas = vtk.vtkGeneralTransform()
slicer.vtkMRMLTransformNode.GetTransformBetweenNodes(None, volumeNode.GetParentTransformNode(), transformRasToVolumeRas)
point_VolumeRas = transformRasToVolumeRas.TransformPoint(point_Ras)
# Get voxel coordinates from physical coordinates
volumeRasToIjk = vtk.vtkMatrix4x4()
volumeNode.GetRASToIJKMatrix(volumeRasToIjk)
point_Ijk = [0, 0, 0, 1]
volumeRasToIjk.MultiplyPoint(np.append(point_VolumeRas,1.0), point_Ijk)
point_Ijk = [ int(round(c)) for c in point_Ijk[0:3] ]
# Print output
print(point_Ijk)
Get markup control point RAS coordinates from volume voxel coordinates
This example shows how to get position of maximum intensity voxel of a volume (determined by numpy, in IJK coordinates) in RAS coordinates so that it can be marked with a markup control point.
# Inputs
volumeNode = getNode("MRHead")
pointListNode = getNode("F")
# Get voxel position in IJK coordinate system
import numpy as np
volumeArray = slicer.util.arrayFromVolume(volumeNode)
# Get position of highest voxel value
point_Kji = np.where(volumeArray == volumeArray.max())
point_Ijk = [point_Kji[2][0], point_Kji[1][0], point_Kji[0][0]]
# Get physical coordinates from voxel coordinates
volumeIjkToRas = vtk.vtkMatrix4x4()
volumeNode.GetIJKToRASMatrix(volumeIjkToRas)
point_VolumeRas = [0, 0, 0, 1]
volumeIjkToRas.MultiplyPoint(np.append(point_Ijk,1.0), point_VolumeRas)
# If volume node is transformed, apply that transform to get volume's RAS coordinates
transformVolumeRasToRas = vtk.vtkGeneralTransform()
slicer.vtkMRMLTransformNode.GetTransformBetweenNodes(volumeNode.GetParentTransformNode(), None, transformVolumeRasToRas)
point_Ras = transformVolumeRasToRas.TransformPoint(point_VolumeRas[0:3])
# Add a markup at the computed position and print its coordinates
pointListNode.AddControlPoint((point_Ras[0], point_Ras[1], point_Ras[2]), "max")
print(point_Ras)
Get the values of all voxels for a label value
If you have a background image called ‘Volume’ and a mask called ‘Volume-label’ created with the Segment Editor you could do something like this:
import numpy
volume = array("Volume")
label = array("Volume-label")
points = numpy.where( label == 1 ) # or use another label number depending on what you segmented
values = volume[points] # this will be a list of the label values
values.mean() # should match the mean value of LabelStatistics calculation as a double-check
numpy.savetxt("values.txt", values)
Access values in a DTI tensor volume
This example shows how to access individual tensors at the voxel level.
First load your DWI volume and estimate tensors to produce a DTI volume called ‘Output DTI Volume’.
Then open the python window: View->Python console.
Use this command to access tensors through numpy:
tensors = array("Output DTI Volume")
Type the following code into the Python window to access all tensor components using vtk commands:
volumeNode=slicer.util.getNode("Output DTI Volume")
imageData=volumeNode.GetImageData()
tensors = imageData.GetPointData().GetTensors()
extent = imageData.GetExtent()
idx = 0
for k in range(extent[4], extent[5]+1):
for j in range(extent[2], extent[3]+1):
for i in range(extent[0], extent[1]+1):
tensors.GetTuple9(idx)
idx += 1
Change window/level (brightness/contrast) or colormap of a volume
This example shows how to change window/level of the MRHead sample volume.
volumeNode = getNode("MRHead")
displayNode = volumeNode.GetDisplayNode()
displayNode.AutoWindowLevelOff()
displayNode.SetWindow(50)
displayNode.SetLevel(100)
Change color mapping from grayscale to rainbow:
displayNode.SetAndObserveColorNodeID("vtkMRMLColorTableNodeRainbow")
Make mouse left-click and drag on the image adjust window/level
In older Slicer versions, by default, left-click and drag in a slice view adjusted window/level of the displayed image. Window/level adjustment is now a new mouse mode that can be activated by clicking on its toolbar button or running this code:
slicer.app.applicationLogic().GetInteractionNode().SetCurrentInteractionMode(slicer.vtkMRMLInteractionNode.AdjustWindowLevel)
Reset field of view to show background volume maximized
Equivalent to click small rectangle button (“Adjust the slice viewer’s field of view…”) in the slice view controller.
slicer.util.resetSliceViews()
Rotate slice views to volume plane
Aligns slice views to volume axes, shows original image acquisition planes in slice views.
volumeNode = slicer.util.getNode("MRHead")
layoutManager = slicer.app.layoutManager()
for sliceViewName in layoutManager.sliceViewNames():
layoutManager.sliceWidget(sliceViewName).mrmlSliceNode().RotateToVolumePlane(volumeNode)
Iterate over current visible slice views, and set foreground and background images
slicer.util.setSliceViewerLayers(background=mrVolume, foreground=ctVolume)
Internally, this method performs something like this:
layoutManager = slicer.app.layoutManager()
for sliceViewName in layoutManager.sliceViewNames():
compositeNode = layoutManager.sliceWidget(sliceViewName).sliceLogic().GetSliceCompositeNode()
# Setup background volume
compositeNode.SetBackgroundVolumeID(mrVolume.GetID())
# Setup foreground volume
compositeNode.SetForegroundVolumeID(ctVolume.GetID())
# Change opacity
compositeNode.SetForegroundOpacity(0.3)
Show a volume in slice views
Recommended:
volumeNode = slicer.util.getNode("YourVolumeNode")
slicer.util.setSliceViewerLayers(background=volumeNode)
or
Show volume in all visible views where volume selection propagation is enabled:
volumeNode = slicer.util.getNode("YourVolumeNode")
applicationLogic = slicer.app.applicationLogic()
selectionNode = applicationLogic.GetSelectionNode()
selectionNode.SetSecondaryVolumeID(volumeNode.GetID())
applicationLogic.PropagateForegroundVolumeSelection(0)
or
Show volume in selected views:
n = slicer.util.getNode("YourVolumeNode")
for color in ["Red", "Yellow", "Green"]:
slicer.app.layoutManager().sliceWidget(color).sliceLogic().GetSliceCompositeNode().SetForegroundVolumeID(n.GetID())
Change opacity of foreground volume in slice views
slicer.util.setSliceViewerLayers(foregroundOpacity=0.4)
or
Change opacity in a selected view
lm = slicer.app.layoutManager()
sliceLogic = lm.sliceWidget("Red").sliceLogic()
compositeNode = sliceLogic.GetSliceCompositeNode()
compositeNode.SetForegroundOpacity(0.4)
Turning off interpolation
You can turn off interpolation for newly loaded volumes with this script from Steve Pieper.
def NoInterpolate(caller,event):
for node in slicer.util.getNodes("*").values():
if node.IsA("vtkMRMLScalarVolumeDisplayNode"):
node.SetInterpolate(0)
slicer.mrmlScene.AddObserver(slicer.mrmlScene.NodeAddedEvent, NoInterpolate)
You can place this code snippet in your .slicerrc.py file to always disable interpolation by default.
Running an ITK filter in Python using SimpleITK
Open the “Sample Data” module and download “MR Head”, then paste the following snippet in Python console:
import SampleData
import SimpleITK as sitk
import sitkUtils
# Get input volume node
inputVolumeNode = SampleData.SampleDataLogic().downloadMRHead()
# Create new volume node for output
outputVolumeNode = slicer.mrmlScene.AddNewNodeByClass("vtkMRMLScalarVolumeNode", "MRHeadFiltered")
# Run processing
inputImage = sitkUtils.PullVolumeFromSlicer(inputVolumeNode)
filter = sitk.SignedMaurerDistanceMapImageFilter()
outputImage = filter.Execute(inputImage)
sitkUtils.PushVolumeToSlicer(outputImage, outputVolumeNode)
# Show processing result
slicer.util.setSliceViewerLayers(background=outputVolumeNode)
More information:
See the SimpleITK documentation for SimpleITK examples: https://simpleitk.org/doxygen/latest/html/examples.html
sitkUtils in Slicer is used for pushing and pulling images from Slicer to SimpleITK: https://github.com/Slicer/Slicer/blob/main/Base/Python/sitkUtils.py
Get axial slice as numpy array
An axis-aligned (axial/sagittal/coronal/) slices of a volume can be extracted using simple numpy array indexing. For example:
import SampleData
volumeNode = SampleData.SampleDataLogic().downloadMRHead()
sliceIndex = 12
voxels = slicer.util.arrayFromVolume(volumeNode) # Get volume as numpy array
slice = voxels[sliceIndex:,:] # Get one slice of the volume as numpy array
Get reformatted image from a slice viewer as numpy array
Set up red slice viewer to show thick slab reconstructed from 3 slices:
sliceNodeID = "vtkMRMLSliceNodeRed"
# Get image data from slice view
sliceNode = slicer.mrmlScene.GetNodeByID(sliceNodeID)
appLogic = slicer.app.applicationLogic()
sliceLogic = appLogic.GetSliceLogic(sliceNode)
sliceLayerLogic = sliceLogic.GetBackgroundLayer()
reslice = sliceLayerLogic.GetReslice()
reslicedImage = vtk.vtkImageData()
reslicedImage.DeepCopy(reslice.GetOutput())
# Create new volume node using resliced image
volumeNode = slicer.mrmlScene.AddNewNodeByClass("vtkMRMLScalarVolumeNode")
volumeNode.SetIJKToRASMatrix(sliceNode.GetXYToRAS())
volumeNode.SetAndObserveImageData(reslicedImage)
volumeNode.CreateDefaultDisplayNodes()
volumeNode.CreateDefaultStorageNode()
# Get voxels as a numpy array
voxels = slicer.util.arrayFromVolume(volumeNode)
print(voxels.shape)
Combine multiple volumes into one
This example combines two volumes into a new one by subtracting one from the other.
import SampleData
[input1Volume, input2Volume] = SampleData.SampleDataLogic().downloadDentalSurgery()
import slicer.util
a = slicer.util.arrayFromVolume(input1Volume)
b = slicer.util.arrayFromVolume(input2Volume)
# `a` and `b` are numpy arrays,
# they can be combined using any numpy array operations
# to produce the result array `c`
c = b - a
volumeNode = slicer.modules.volumes.logic().CloneVolume(input1Volume, "Difference")
slicer.util.updateVolumeFromArray(volumeNode, c)
slicer.util.setSliceViewerLayers(background=volumeNode)
Add noise to image
This example shows how to add simulated noise to a volume.
import SampleData
import numpy as np
# Get a sample input volume node
volumeNode = SampleData.SampleDataLogic().downloadMRHead()
# Get volume as numpy array and add noise
voxels = slicer.util.arrayFromVolume(volumeNode)
voxels[:] = voxels + np.random.normal(0.0, 20.0, size=voxels.shape)
slicer.util.arrayFromVolumeModified(volumeNode)
Mask volume using segmentation
This example shows how to blank out voxels of a volume outside all segments.
# Input nodes
volumeNode = getNode("MRHead")
segmentationNode = getNode("Segmentation")
# Write segmentation to labelmap volume node with a geometry that matches the volume node
labelmapVolumeNode = slicer.mrmlScene.AddNewNodeByClass("vtkMRMLLabelMapVolumeNode")
slicer.modules.segmentations.logic().ExportVisibleSegmentsToLabelmapNode(segmentationNode, labelmapVolumeNode, volumeNode)
# Masking
import numpy as np
voxels = slicer.util.arrayFromVolume(volumeNode)
mask = slicer.util.arrayFromVolume(labelmapVolumeNode)
maskedVoxels = np.copy(voxels) # we don't want to modify the original volume
maskedVoxels[mask==0] = 0
# Write masked volume to volume node and show it
maskedVolumeNode = slicer.modules.volumes.logic().CloneVolume(volumeNode, "Masked")
slicer.util.updateVolumeFromArray(maskedVolumeNode, maskedVoxels)
slicer.util.setSliceViewerLayers(background=maskedVolumeNode)
Apply random deformations to image
This example shows how to apply random translation, rotation, and deformations to a volume to simulate variation in patient positioning, soft tissue motion, and random anatomical variations. Control points are placed on a regularly spaced grid and then each control point is displaced by a random amount. Thin-plate spline transform is computed from the original and transformed point list.
https://gist.github.com/lassoan/428af5285da75dc033d32ebff65ba940
Thick slab reconstruction and maximum/minimum intensity volume projections
Set up red slice viewer to show thick slab reconstructed from 3 slices:
sliceNode = slicer.mrmlScene.GetNodeByID("vtkMRMLSliceNodeRed")
appLogic = slicer.app.applicationLogic()
sliceLogic = appLogic.GetSliceLogic(sliceNode)
sliceLayerLogic = sliceLogic.GetBackgroundLayer()
reslice = sliceLayerLogic.GetReslice()
reslice.SetSlabModeToMean()
reslice.SetSlabNumberOfSlices(10) # mean of 10 slices will computed
reslice.SetSlabSliceSpacingFraction(0.3) # spacing between each slice is 0.3 pixel (total 10 * 0.3 = 3 pixel neighborhood)
sliceNode.Modified()
Set up red slice viewer to show maximum intensity projection (MIP):
sliceNode = slicer.mrmlScene.GetNodeByID("vtkMRMLSliceNodeRed")
appLogic = slicer.app.applicationLogic()
sliceLogic = appLogic.GetSliceLogic(sliceNode)
sliceLayerLogic = sliceLogic.GetBackgroundLayer()
reslice = sliceLayerLogic.GetReslice()
reslice.SetSlabModeToMax()
reslice.SetSlabNumberOfSlices(600) # use a large number of slices (600) to cover the entire volume
reslice.SetSlabSliceSpacingFraction(0.5) # spacing between slices are 0.5 pixel (supersampling is useful to reduce interpolation artifacts)
sliceNode.Modified()
The projected image is available in a vtkImageData object by calling reslice.GetOutput().
Display volume using volume rendering
logic = slicer.modules.volumerendering.logic()
volumeNode = slicer.mrmlScene.GetNodeByID('vtkMRMLScalarVolumeNode1')
displayNode = logic.CreateVolumeRenderingDisplayNode()
displayNode.UnRegister(logic)
slicer.mrmlScene.AddNode(displayNode)
volumeNode.AddAndObserveDisplayNodeID(displayNode.GetID())
logic.UpdateDisplayNodeFromVolumeNode(displayNode, volumeNode)
C++:
qSlicerAbstractCoreModule* volumeRenderingModule =
qSlicerCoreApplication::application()->moduleManager()->module("VolumeRendering");
vtkSlicerVolumeRenderingLogic* volumeRenderingLogic =
volumeRenderingModule ? vtkSlicerVolumeRenderingLogic::SafeDownCast(volumeRenderingModule->logic()) : 0;
vtkMRMLVolumeNode* volumeNode = mrmlScene->GetNodeByID("vtkMRMLScalarVolumeNode1");
if (volumeRenderingLogic)
{
vtkSmartPointer<vtkMRMLVolumeRenderingDisplayNode> displayNode =
vtkSmartPointer<vtkMRMLVolumeRenderingDisplayNode>::Take(volumeRenderingLogic->CreateVolumeRenderingDisplayNode());
mrmlScene->AddNode(displayNode);
volumeNode->AddAndObserveDisplayNodeID(displayNode->GetID());
volumeRenderingLogic->UpdateDisplayNodeFromVolumeNode(displayNode, volumeNode);
}
Apply a custom volume rendering color/opacity transfer function
vtkColorTransferFunction* colors = ...
vtkPiecewiseFunction* opacities = ...
vtkMRMLVolumeRenderingDisplayNode* displayNode = ...
vtkMRMLVolumePropertyNode* propertyNode = displayNode->GetVolumePropertyNode();
propertyNode->SetColor(colorTransferFunction);
propertyNode->SetScalarOpacity(opacities);
// optionally set the gradients opacities with SetGradientOpacity
Volume rendering logic has utility functions to help you create those transfer functions: SetWindowLevelToVolumeProp, SetThresholdToVolumeProp, SetLabelMapToVolumeProp.
Limit volume rendering to a specific region of the volume
displayNode.SetAndObserveROINodeID(roiNode.GetID())
displayNode.CroppingEnabled = True
C++:
vtkMRMLMarkupsROINode* roiNode =...
vtkMRMLVolumeRenderingDisplayNode* displayNode = ...
displayNode->SetAndObserveROINodeID(roiNode->GetID());
displayNode->SetCroppingEnabled(1);
Register a new Volume Rendering mapper
You need to derive from vtkMRMLVolumeRenderingDisplayNode and register your class within vtkSlicerVolumeRenderingLogic.
C++:
void qSlicerMyABCVolumeRenderingModule::setup()
{
vtkMRMLThreeDViewDisplayableManagerFactory::GetInstance()->
RegisterDisplayableManager("vtkMRMLMyABCVolumeRenderingDisplayableManager");
this->Superclass::setup();
qSlicerAbstractCoreModule* volumeRenderingModule =
qSlicerCoreApplication::application()->moduleManager()->module("VolumeRendering");
if (volumeRenderingModule)
{
vtkNew<vtkMRMLMyABCVolumeRenderingDisplayNode> displayNode;
vtkSlicerVolumeRenderingLogic* volumeRenderingLogic =
vtkSlicerVolumeRenderingLogic::SafeDownCast(volumeRenderingModule->logic());
volumeRenderingLogic->RegisterRenderingMethod(
"My ABC Volume Rendering", displayNode->GetClassName());
}
else
{
qWarning() << "Volume Rendering module is not found";
}
}
If you want to expose control widgets for your volume rendering method, then register your widget with addRenderingMethodWidget().
Register custom volume rendering presets
Custom presets can be added to the volume rendering module by calling AddPreset() method of the volume rendering module logic. The example below shows how to define multiple custom volume rendering presets in an external MRML scene file and add them to the volume rendering module user interface.
Create a MyPresets.mrml file that describes two custom volume rendering presets:
<MRML version="Slicer4.4.0">
<VolumeProperty id="vtkMRMLVolumeProperty1" name="MyPreset1" references="IconVolume:vtkMRMLVectorVolumeNode1;" interpolation="1" shade="1" diffuse="0.66" ambient="0.1" specular="0.62" specularPower="14" scalarOpacity="10 -3.52844023704529 0 56.7852325439453 0 79.2550277709961 0.428571432828903 415.119384765625 1 641 1" gradientOpacity="4 0 1 160.25 1" colorTransfer="16 0 0 0 0 98.7223 0.196078431372549 0.945098039215686 0.956862745098039 412.406 0 0.592157 0.807843 641 1 1 1" />
<VectorVolume id="vtkMRMLVectorVolumeNode1" references="storage:vtkMRMLVolumeArchetypeStorageNode1;" />
<VolumeArchetypeStorage id="vtkMRMLVolumeArchetypeStorageNode1" fileName="MyPreset1.png" fileListMember0="MyPreset1.png" />
<VolumeProperty id="vtkMRMLVolumeProperty2" name="MyPreset2" references="IconVolume:vtkMRMLVectorVolumeNode2;" interpolation="1" shade="1" diffuse="0.66" ambient="0.1" specular="0.62" specularPower="14" scalarOpacity="10 -3.52844023704529 0 56.7852325439453 0 79.2550277709961 0.428571432828903 415.119384765625 1 641 1" gradientOpacity="4 0 1 160.25 1" colorTransfer="16 0 0 0 0 98.7223 0.196078431372549 0.945098039215686 0.956862745098039 412.406 0 0.592157 0.807843 641 1 1 1" />
<VectorVolume id="vtkMRMLVectorVolumeNode2" references="storage:vtkMRMLVolumeArchetypeStorageNode2;" />
<VolumeArchetypeStorage id="vtkMRMLVolumeArchetypeStorageNode2" fileName="MyPreset2.png" fileListMember0="MyPreset2.png" />
</MRML>
For this example, thumbnail images for the presets should be located in the same directory as MyPresets.mrml, with the file names MyPreset1.png and MyPreset2.png.
Use the following code to read all the custom presets from MyPresets.mrml and load it into the scene:
presetsScenePath = "MyPresets.mrml"
# Read presets scene
customPresetsScene = slicer.vtkMRMLScene()
vrPropNode = slicer.vtkMRMLVolumePropertyNode()
customPresetsScene.RegisterNodeClass(vrPropNode)
customPresetsScene.SetURL(presetsScenePath)
customPresetsScene.Connect()
# Add presets to volume rendering logic
vrLogic = slicer.modules.volumerendering.logic()
presetsScene = vrLogic.GetPresetsScene()
vrNodes = customPresetsScene.GetNodesByClass("vtkMRMLVolumePropertyNode")
vrNodes.UnRegister(None)
for itemNum in range(vrNodes.GetNumberOfItems()):
node = vrNodes.GetItemAsObject(itemNum)
vrLogic.AddPreset(node)
Batch processing
Iterate through dicom series
This examples shows how to perform an operation on each series in the dicom database.
db = slicer.dicomDatabase
patients = db.patients()
patientCount = 0
for patient in patients:
patientCount += 1
print(f"Patient {patient} ({patientCount} of {len(patients)})")
for study in db.studiesForPatient(patient):
print(f"Study {study}")
for series in db.seriesForStudy(study):
print(f"Series {series}")
temporaryDir = qt.QTemporaryDir()
for instanceUID in db.instancesForSeries(series):
qt.QFile.copy(db.fileForInstance(instanceUID), f"{temporaryDir.path()}/{instanceUID}.dcm")
patientID = slicer.dicomDatabase.instanceValue(instanceUID, '0010,0020')
outputPath = os.path.join(convertedPath, patientID, study, series, "BatchResult")
if not os.path.exists(outputPath):
os.makedirs(outputPath)
# do an operation here that processes the series into the outputPath
Note
It can be helpful for debugging to include a comment with python commands that can be pasted into the console to run the script. With this approach any global variables, such as vtk class instances, defined in the script will exist after the script runs and you can easily inspect them or call methods on them.
"""
filePath = "/data/myscript.py"
exec(open(filePath).read())
"""
Extracting volume patches around segments
For machine learning apps, such as MONAI Label it can be helpful to reduce the size of the problem by extracting out subsets of data. This example shows how to iterate through a directory of segmentations, compute their bounding boxes, and save out new volumes and segmentations centered around the segmentation.
Here the ROI is aligned with the volume. See Segmentations for examples using oriented bounding boxes and other options.
import glob
import os
def segROI(segmentationNode):
# Compute bounding boxes
import SegmentStatistics
segStatLogic = SegmentStatistics.SegmentStatisticsLogic()
segStatLogic.getParameterNode().SetParameter("Segmentation", segmentationNode.GetID())
segStatLogic.getParameterNode().SetParameter("LabelmapSegmentStatisticsPlugin.obb_origin_ras.enabled",str(True))
segStatLogic.getParameterNode().SetParameter("LabelmapSegmentStatisticsPlugin.obb_diameter_mm.enabled",str(True))
segStatLogic.getParameterNode().SetParameter("LabelmapSegmentStatisticsPlugin.obb_direction_ras_x.enabled",str(True))
segStatLogic.getParameterNode().SetParameter("LabelmapSegmentStatisticsPlugin.obb_direction_ras_y.enabled",str(True))
segStatLogic.getParameterNode().SetParameter("LabelmapSegmentStatisticsPlugin.obb_direction_ras_z.enabled",str(True))
segStatLogic.computeStatistics()
stats = segStatLogic.getStatistics()
# Draw ROI for each oriented bounding box
import numpy as np
for segmentId in stats["SegmentIDs"]:
# Get bounding box
obb_origin_ras = np.array(stats[segmentId,"LabelmapSegmentStatisticsPlugin.obb_origin_ras"])
obb_diameter_mm = np.array(stats[segmentId,"LabelmapSegmentStatisticsPlugin.obb_diameter_mm"])
obb_direction_ras_x = np.array(stats[segmentId,"LabelmapSegmentStatisticsPlugin.obb_direction_ras_x"])
obb_direction_ras_y = np.array(stats[segmentId,"LabelmapSegmentStatisticsPlugin.obb_direction_ras_y"])
obb_direction_ras_z = np.array(stats[segmentId,"LabelmapSegmentStatisticsPlugin.obb_direction_ras_z"])
# Create ROI
segment = segmentationNode.GetSegmentation().GetSegment(segmentId)
roi=slicer.mrmlScene.AddNewNodeByClass("vtkMRMLMarkupsROINode")
roi.SetName(segment.GetName() + " OBB")
roi.GetDisplayNode().SetHandlesInteractive(False) # do not let the user resize the box
roi.SetSize(obb_diameter_mm * 2) # make the ROI twice the size of the segmentation
# Position and orient ROI using a transform
obb_center_ras = obb_origin_ras+0.5*(obb_diameter_mm[0] * obb_direction_ras_x + obb_diameter_mm[1] * obb_direction_ras_y + obb_diameter_mm[2] * obb_direction_ras_z)
boundingBoxToRasTransform = np.row_stack((np.column_stack(((1,0,0), (0,1,0), (0,0,1), obb_center_ras)), (0, 0, 0, 1)))
boundingBoxToRasTransformMatrix = slicer.util.vtkMatrixFromArray(boundingBoxToRasTransform)
roi.SetAndObserveObjectToNodeMatrix(boundingBoxToRasTransformMatrix)
return roi
labelFiles = glob.glob("/data/imagesTr/labels/final/*.nii.gz")
for labelFile in labelFiles:
slicer.mrmlScene.Clear()
print(labelFile)
baseName = os.path.basename(labelFile)
ctFile = os.path.join("/data/imagesTr", baseName)
print(ctFile)
ct = slicer.util.loadVolume(ctFile)
seg = slicer.util.loadSegmentation(labelFile)
roi = segROI(seg)
cropVolumeParameters = slicer.mrmlScene.AddNewNodeByClass("vtkMRMLCropVolumeParametersNode")
cropVolumeParameters.SetInputVolumeNodeID(ct.GetID())
cropVolumeParameters.SetROINodeID(roi.GetID())
slicer.modules.cropvolume.logic().Apply(cropVolumeParameters)
croppedCT = cropVolumeParameters.GetOutputVolumeNode()
seg.SetReferenceImageGeometryParameterFromVolumeNode(croppedCT)
segLogic = slicer.modules.segmentations.logic()
labelmap = slicer.mrmlScene.AddNewNodeByClass("vtkMRMLLabelMapVolumeNode")
segLogic.ExportAllSegmentsToLabelmapNode(seg, labelmap, slicer.vtkSegmentation.EXTENT_REFERENCE_GEOMETRY)
slicer.util.saveNode(croppedCT, f"/data/crops/{baseName}")
slicer.util.saveNode(labelmap, f"/data/crops/labels/final/{baseName}")
slicer.app.processEvents() # to watch progress
WebServer
Create a custom web server instance to serve static content
import WebServer
import WebServerLib
# serve content from the temp directory on port 9916 and print all messages
handler = WebServerLib.StaticPagesRequestHandler(docroot=b"/tmp", logMessage=print)
logic = WebServer.WebServerLogic(port=9916, requestHandlers=[handler], logMessage=print)
logic.start()
print(f"Open 'http://localhost:{logic.port}'")
# stop later with logic.stop()
Note
Hosting web content is a complex topic, with security implications. Use this feature with caution. It’s best to use this only on a trusted network.
Create a custom web server to handle request endpoints
See the WebServerLib for more complete examples.
import urllib
import WebServer
import WebServerLib
class ExampleRequestHandler(WebServerLib.BaseRequestHandler):
def __init__(self, logMessage = None):
"""
Initialize a new Example request handler instance.
:param logMessage: An optional external handle for message logging.
"""
self.logMessage = logMessage
def canHandleRequest(self, uri: bytes, **_kwargs) -> float:
"""
Whether the given request is a Example request.
:param uri: The request URI to parse.
:return: 0.5 confidence if the request is an Example request, else 0.0
"""
parsedURL = urllib.parse.urlparse(uri)
return 0.5 if parsedURL.path.startswith(b"/example") else 0.0
def handleRequest(self, method: str, uri: bytes, requestBody: bytes, **_kwargs) -> tuple[bytes, bytes]:
"""
Dispatches various example requests.
:param method: The HTTP request method. 'GET', 'POST', etc.
:param uri: The request URI to parse.
:param requestBody: the binary that came with the request
:return: tuple of content type (based on file ext) and request body binary (contents of file)
"""
parsedURL = urllib.parse.urlparse(uri)
contentType = b"text/plain"
responseBody = None
splitPath = parsedURL.path.split(b"/")
if len(splitPath) > 2 and splitPath[2] == b"ping":
self.logMessage("handling collections")
responseBody = b"pong"
else:
self.logMessage("Unhandled Example request path: %s" % parsedURL.path)
responseBody = b"Unhandled Example request path"
return contentType, responseBody
# create a server with a custom handler class - here it does nothing, but it
# can access and use anything from the Slicer python environment
PORT = 2042
import WebServer
logMessage = WebServer.WebServerLogic.defaultLogMessage
requestHandlers = [ExampleRequestHandler()]
logic = WebServer.WebServerLogic(port=PORT, logMessage=logMessage, enableSlicer=False, enableStaticPages=False, enableDICOM=False, requestHandlers=requestHandlers)
logic.start()
print(f"Open 'http://localhost:{logic.port}/example/ping'")
# stop later with logic.stop()